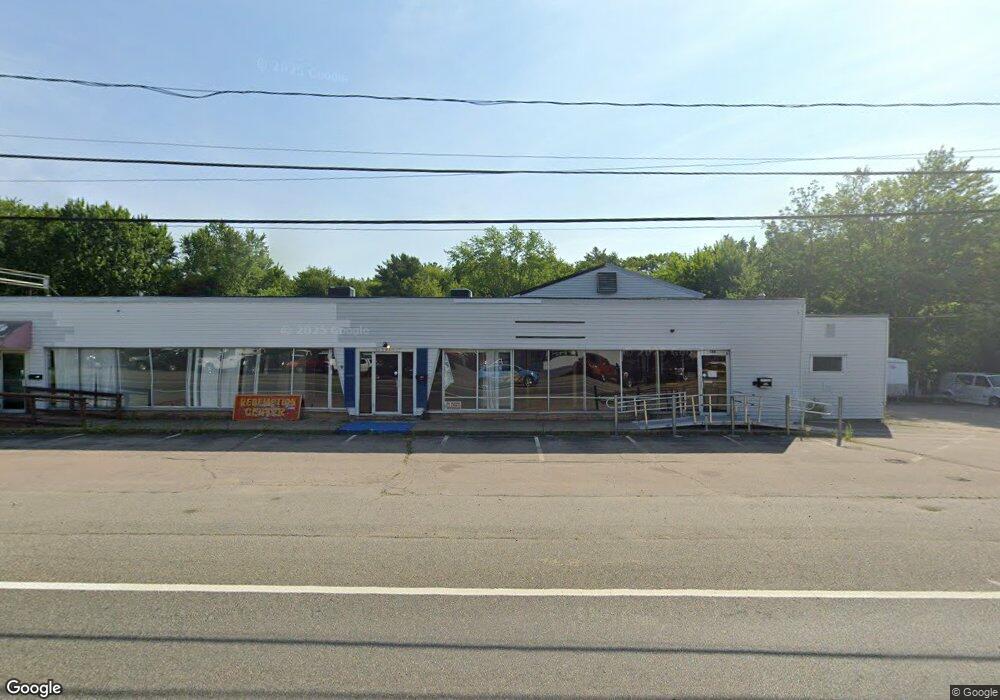
194 S Main St Unit F West Bridgewater, MA 02379
Estimated Value: $1,203,824
3
Beds
2
Baths
1,254
Sq Ft
$960/Sq Ft
Est. Value
About This Home
This home is located at 194 S Main St Unit F, West Bridgewater, MA 02379 and is currently estimated at $1,203,824, approximately $959 per square foot. 194 S Main St Unit F is a home located in Plymouth County with nearby schools including Spring Street Elementary School, Howard Elementary School, and Rose L. MacDonald Elementary School.
Ownership History
Date
Name
Owned For
Owner Type
Purchase Details
Closed on
Jun 15, 2018
Sold by
Belmont Linda A
Bought by
Happy Fours Rt
Current Estimated Value
Purchase Details
Closed on
Jan 25, 2017
Sold by
Lind Rt
Bought by
Belmont Linda A
Home Financials for this Owner
Home Financials are based on the most recent Mortgage that was taken out on this home.
Original Mortgage
$455,000
Interest Rate
4.16%
Mortgage Type
Commercial
Purchase Details
Closed on
Aug 29, 1984
Bought by
Belmont Thomas and Belmont Linda A
Create a Home Valuation Report for This Property
The Home Valuation Report is an in-depth analysis detailing your home's value as well as a comparison with similar homes in the area
Home Values in the Area
Average Home Value in this Area
Purchase History
| Date | Buyer | Sale Price | Title Company |
|---|---|---|---|
| Happy Fours Rt | $699,000 | -- | |
| Belmont Linda A | -- | -- | |
| Belmont Thomas | -- | -- |
Source: Public Records
Mortgage History
| Date | Status | Borrower | Loan Amount |
|---|---|---|---|
| Previous Owner | Belmont Linda A | $455,000 | |
| Previous Owner | Belmont Linda A | $12,500 | |
| Previous Owner | Belmont Thomas | $400,000 | |
| Previous Owner | Belmont Thomas | $375,000 | |
| Previous Owner | Belmont Thomas | $100,000 |
Source: Public Records
Tax History Compared to Growth
Tax History
| Year | Tax Paid | Tax Assessment Tax Assessment Total Assessment is a certain percentage of the fair market value that is determined by local assessors to be the total taxable value of land and additions on the property. | Land | Improvement |
|---|---|---|---|---|
| 2025 | $26,076 | $1,062,150 | $382,200 | $679,950 |
| 2024 | $26,191 | $1,032,750 | $369,200 | $663,550 |
| 2023 | $25,579 | $923,750 | $316,900 | $606,850 |
| 2022 | $25,794 | $887,600 | $316,900 | $570,700 |
| 2021 | $24,284 | $877,300 | $316,900 | $560,400 |
| 2020 | $22,344 | $785,100 | $316,900 | $468,200 |
| 2019 | $22,206 | $803,100 | $320,100 | $483,000 |
| 2018 | $24,324 | $851,100 | $320,100 | $531,000 |
| 2017 | $22,620 | $788,700 | $294,000 | $494,700 |
| 2016 | $22,593 | $775,600 | $280,900 | $494,700 |
| 2015 | $22,497 | $781,700 | $267,800 | $513,900 |
| 2014 | $20,770 | $781,700 | $267,800 | $513,900 |
Source: Public Records
Map
Nearby Homes