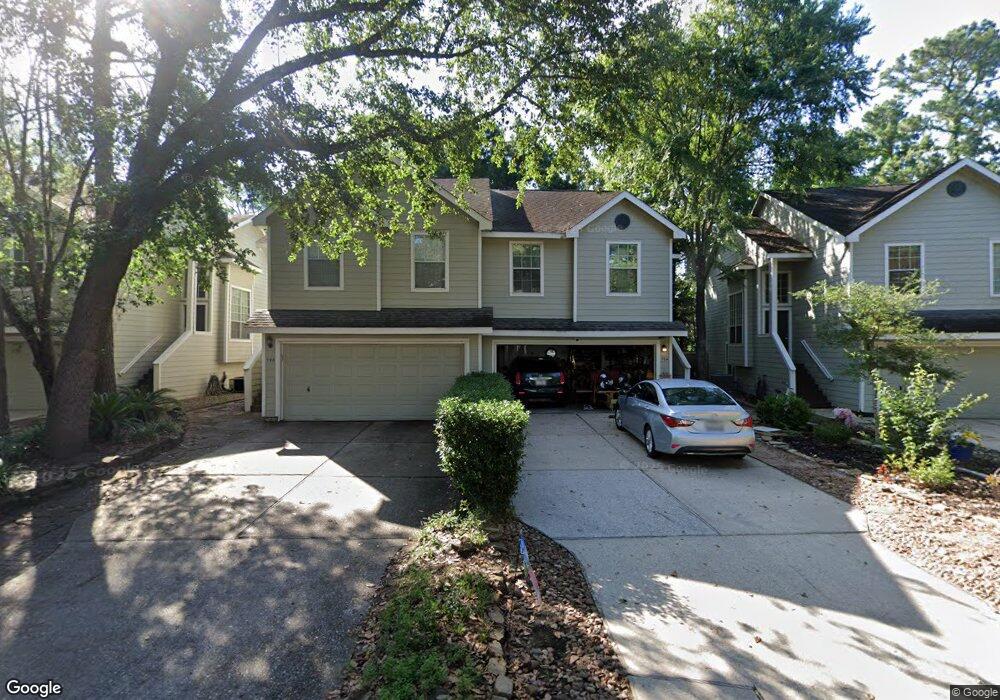
194 S Walden Elms Cir Spring, TX 77382
Alden Bridge NeighborhoodEstimated Value: $252,000 - $280,538
3
Beds
3
Baths
1,233
Sq Ft
$216/Sq Ft
Est. Value
About This Home
This home is located at 194 S Walden Elms Cir, Spring, TX 77382 and is currently estimated at $266,885, approximately $216 per square foot. 194 S Walden Elms Cir is a home located in Montgomery County with nearby schools including Buckalew Elementary School, Mitchell Intermediate School, and McCullough Junior High School.
Ownership History
Date
Name
Owned For
Owner Type
Purchase Details
Closed on
Sep 15, 2014
Sold by
Lyon Christopher B and Lyon Brandi R
Bought by
Baker Don P
Current Estimated Value
Home Financials for this Owner
Home Financials are based on the most recent Mortgage that was taken out on this home.
Original Mortgage
$148,000
Outstanding Balance
$113,346
Interest Rate
4.15%
Mortgage Type
New Conventional
Estimated Equity
$153,539
Purchase Details
Closed on
Oct 29, 1998
Sold by
Lennar Homes Of Texas Land & Construction Ltd
Bought by
Baker Don P
Home Financials for this Owner
Home Financials are based on the most recent Mortgage that was taken out on this home.
Original Mortgage
$86,503
Interest Rate
6.57%
Mortgage Type
FHA
Purchase Details
Closed on
Oct 29, 1997
Sold by
Woodlands Land Dev Lp
Bought by
Baker Don P
Create a Home Valuation Report for This Property
The Home Valuation Report is an in-depth analysis detailing your home's value as well as a comparison with similar homes in the area
Home Values in the Area
Average Home Value in this Area
Purchase History
| Date | Buyer | Sale Price | Title Company |
|---|---|---|---|
| Baker Don P | -- | None Available | |
| Baker Don P | -- | -- | |
| Lyon Christopher B | -- | Regency Title | |
| Baker Don P | -- | -- |
Source: Public Records
Mortgage History
| Date | Status | Borrower | Loan Amount |
|---|---|---|---|
| Open | Baker Don P | $148,000 | |
| Previous Owner | Lyon Christopher B | $86,503 |
Source: Public Records
Tax History Compared to Growth
Tax History
| Year | Tax Paid | Tax Assessment Tax Assessment Total Assessment is a certain percentage of the fair market value that is determined by local assessors to be the total taxable value of land and additions on the property. | Land | Improvement |
|---|---|---|---|---|
| 2025 | $1,506 | $233,941 | $24,987 | $208,954 |
| 2024 | $1,506 | $219,615 | -- | -- |
| 2023 | $1,476 | $199,650 | $24,990 | $210,420 |
| 2022 | $3,679 | $181,500 | $24,990 | $179,650 |
| 2021 | $3,599 | $165,000 | $24,990 | $144,610 |
| 2020 | $3,470 | $150,000 | $24,990 | $125,010 |
| 2019 | $3,644 | $152,690 | $24,990 | $127,700 |
| 2018 | $2,702 | $140,980 | $24,990 | $115,990 |
| 2017 | $3,468 | $143,530 | $24,990 | $118,540 |
| 2016 | $3,486 | $144,270 | $24,990 | $119,280 |
| 2015 | $2,766 | $144,270 | $24,990 | $119,280 |
| 2014 | $2,766 | $113,700 | $24,990 | $88,710 |
Source: Public Records
Map
Nearby Homes
- 230 S Walden Elms Cir
- 19 Timberstar St
- 35 N Walden Elms Cir
- 26 N Walden Elms Cir
- 78 N Walden Elms Cir
- 27 S Belfair Place
- 269 Flaxen Chestnut
- 406 Thistle Thorn Dr
- 242 Flaxen Chestnut
- 70 Harvest Wind Place
- 309 Gotland Russ Ln
- 71 N Acacia Park Cir
- 27 Auburn Path Dr
- 128 Caspian Way
- 39 E Honey Grove Place
- 7 Coachman Ridge Place
- 22 E Sienna Place
- 233 Appaloosa Ct
- 6 Long Springs Place
- 225 Fox Trotter
- 198 S Walden Elms Cir
- 190 S Walden Elms Cir
- 202 S Walden Elms Cir
- 186 S Walden Elms Cir
- 206 S Walden Elms Cir
- 182 S Walden Elms Cir
- 210 S Walden Elms Cir
- 178 S Walden Elms Cir
- 10 Devon Mill Place
- 195 S Walden Elms Cir
- 214 S Walden Elms Cir
- 199 S Walden Elms Cir
- 203 S Walden Elms Cir
- 174 S Walden Elms Cir
- 191 S Walden Elms Cir
- 207 S Walden Elms Cir
- 6 Devon Mill Place
- 35 N Belfair Place
- 218 S Walden Elms Cir
- 211 S Walden Elms Cir