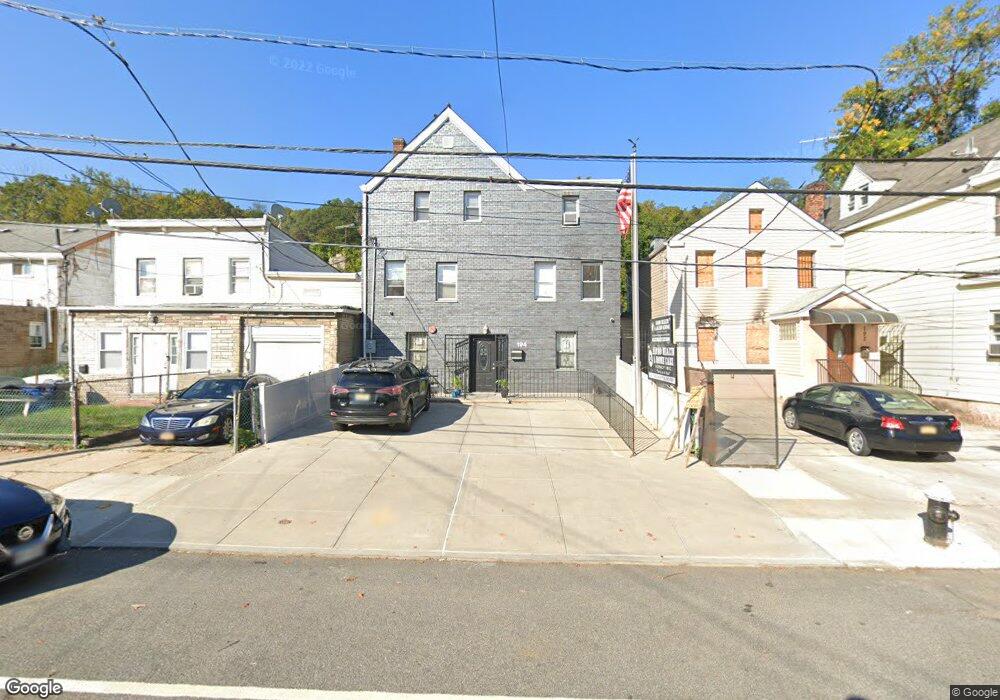
194 Targee St Staten Island, NY 10304
Stapleton NeighborhoodEstimated Value: $515,624
5
Beds
2
Baths
2,137
Sq Ft
$241/Sq Ft
Est. Value
About This Home
This home is located at 194 Targee St, Staten Island, NY 10304 and is currently estimated at $515,624, approximately $241 per square foot. 194 Targee St is a home located in Richmond County with nearby schools including P.S. 78, P.S./I.S. 78Q Early Childhood Center, and I.S. 49 Berta A Dreyfus.
Ownership History
Date
Name
Owned For
Owner Type
Purchase Details
Closed on
Jun 27, 2006
Sold by
Masmo Properties Inc
Bought by
Agboola Abiola
Current Estimated Value
Purchase Details
Closed on
Apr 27, 2006
Sold by
Lasalle Bank Na
Bought by
Masmo Properties Inc
Purchase Details
Closed on
Oct 18, 1999
Sold by
Clason Management Corp
Bought by
Dasilva Marian
Home Financials for this Owner
Home Financials are based on the most recent Mortgage that was taken out on this home.
Original Mortgage
$176,500
Interest Rate
7.83%
Mortgage Type
FHA
Purchase Details
Closed on
Feb 24, 1999
Sold by
Federal National Mortgage Association
Bought by
Clason Management Corp
Purchase Details
Closed on
Aug 14, 1998
Sold by
Cilento Frank and Rupelli Gregory
Bought by
Federal National Mortgage Association
Create a Home Valuation Report for This Property
The Home Valuation Report is an in-depth analysis detailing your home's value as well as a comparison with similar homes in the area
Home Values in the Area
Average Home Value in this Area
Purchase History
| Date | Buyer | Sale Price | Title Company |
|---|---|---|---|
| Agboola Abiola | $315,000 | First Amer Title Ins Co Ny | |
| Masmo Properties Inc | $251,000 | None Available | |
| Dasilva Marian | $178,000 | Commonwealth Land Title Ins | |
| Clason Management Corp | $78,500 | Commonwealth Land Title Ins | |
| Federal National Mortgage Association | $40,000 | Commonwealth Land Title Ins |
Source: Public Records
Mortgage History
| Date | Status | Borrower | Loan Amount |
|---|---|---|---|
| Previous Owner | Dasilva Marian | $176,500 |
Source: Public Records
Tax History Compared to Growth
Tax History
| Year | Tax Paid | Tax Assessment Tax Assessment Total Assessment is a certain percentage of the fair market value that is determined by local assessors to be the total taxable value of land and additions on the property. | Land | Improvement |
|---|---|---|---|---|
| 2025 | $21,296 | $213,750 | $83,430 | $130,320 |
| 2024 | $21,296 | $209,250 | $79,560 | $129,690 |
| 2023 | $20,466 | $192,240 | $71,820 | $120,420 |
| 2022 | $18,982 | $208,350 | $87,300 | $121,050 |
| 2021 | $17,372 | $162,450 | $67,950 | $94,500 |
| 2020 | $16,719 | $192,150 | $67,950 | $124,200 |
| 2019 | $18,547 | $165,150 | $48,600 | $116,550 |
| 2018 | $13,778 | $154,350 | $48,600 | $105,750 |
| 2017 | $12,733 | $149,400 | $48,600 | $100,800 |
| 2016 | $11,769 | $132,300 | $38,700 | $93,600 |
| 2015 | $9,752 | $117,000 | $38,700 | $78,300 |
| 2014 | $9,752 | $102,150 | $38,700 | $63,450 |
Source: Public Records
Map
Nearby Homes
- 192 Targee St
- 198 Targee St
- 188 Targee St
- 200 Targee St
- 182 Targee St
- 208 Targee St
- 180 Targee St
- 206 Targee St
- 203 Targee St
- 302 Broad St
- 185 Targee St Unit 2nd Floor
- 185 Targee St
- 193 Targee St
- 197 Targee St
- 191 Targee St
- 210 Targee St
- 187 Targee St
- 205 Targee St
- 308 Broad St
- 308 Broad St Unit 1FL