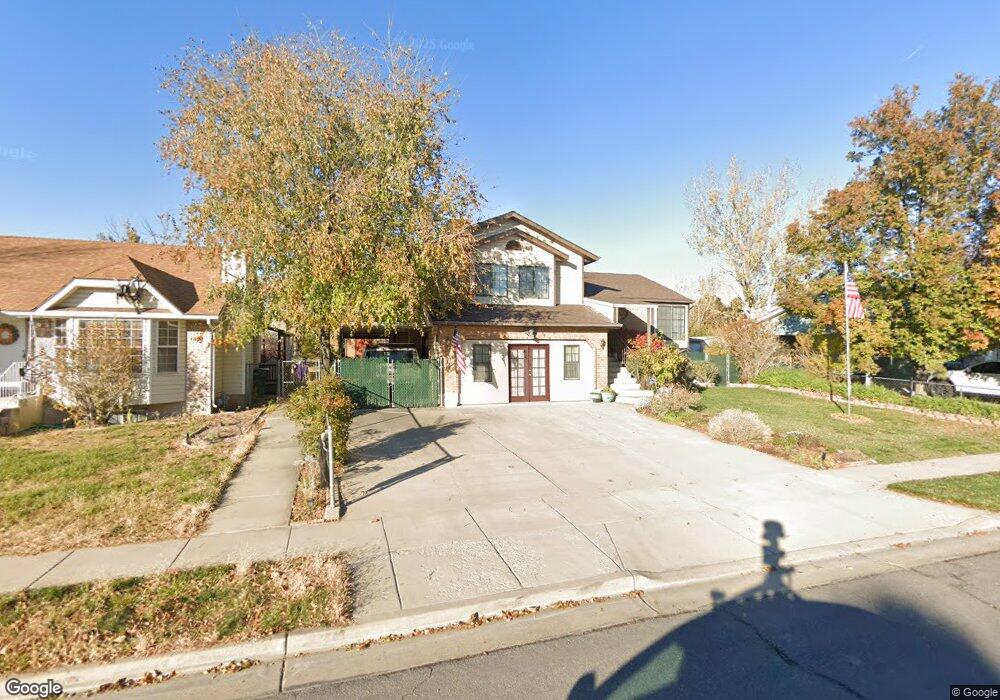
194 W 1275 N Layton, UT 84041
Estimated Value: $437,567 - $477,000
4
Beds
3
Baths
1,284
Sq Ft
$357/Sq Ft
Est. Value
About This Home
This home is located at 194 W 1275 N, Layton, UT 84041 and is currently estimated at $458,892, approximately $357 per square foot. 194 W 1275 N is a home located in Davis County with nearby schools including Crestview Elementary School, Central Davis Junior High School, and Northridge High School.
Ownership History
Date
Name
Owned For
Owner Type
Purchase Details
Closed on
Dec 9, 2024
Sold by
Phath Chamrann
Bought by
Chamrann Phath Revocable Living Trust and Phath
Current Estimated Value
Purchase Details
Closed on
Feb 9, 2019
Sold by
Phetsysouk Toukta and Phath Chamrann
Bought by
Phath Chamrann
Purchase Details
Closed on
Jun 1, 2018
Sold by
Phetsysouk Toukta and Phetsysouk Amphone
Bought by
Phetsysouk Toukta and Phath Chamrann
Purchase Details
Closed on
Jun 24, 2008
Sold by
Fowers Toukta
Bought by
Phetsisouk Amphone
Purchase Details
Closed on
Mar 5, 2007
Sold by
Phetsisouk Amphone
Bought by
Phetsisouk Amphone P and Fowers Toukta
Create a Home Valuation Report for This Property
The Home Valuation Report is an in-depth analysis detailing your home's value as well as a comparison with similar homes in the area
Home Values in the Area
Average Home Value in this Area
Purchase History
| Date | Buyer | Sale Price | Title Company |
|---|---|---|---|
| Chamrann Phath Revocable Living Trust | -- | None Listed On Document | |
| Phath Chamrann | -- | None Available | |
| Phetsysouk Toukta | -- | None Available | |
| Phetsisouk Amphone | -- | None Available | |
| Phetsisouk Amphone P | -- | None Available |
Source: Public Records
Tax History Compared to Growth
Tax History
| Year | Tax Paid | Tax Assessment Tax Assessment Total Assessment is a certain percentage of the fair market value that is determined by local assessors to be the total taxable value of land and additions on the property. | Land | Improvement |
|---|---|---|---|---|
| 2025 | $33 | $228,250 | $101,220 | $127,030 |
| 2024 | $0 | $219,450 | $117,989 | $101,461 |
| 2023 | $204 | $383,000 | $140,713 | $242,287 |
| 2022 | $2,108 | $213,400 | $74,266 | $139,134 |
| 2021 | $78 | $290,000 | $103,826 | $186,174 |
| 2020 | $32 | $252,000 | $87,509 | $164,491 |
| 2019 | $160 | $242,000 | $83,247 | $158,753 |
| 2018 | $1,531 | $218,000 | $83,247 | $134,753 |
| 2016 | $1,435 | $105,380 | $26,501 | $78,879 |
| 2015 | $1,354 | $94,435 | $26,501 | $67,934 |
| 2014 | $1,307 | $93,191 | $26,501 | $66,690 |
| 2013 | -- | $92,550 | $26,884 | $65,666 |
Source: Public Records
Map
Nearby Homes
- 103 W 1275 N
- 1490 N 175 W
- 1096 N 300 W
- 1180 N 100 E
- 1583 N 25 E
- 324 E 1325 N
- 1553 N 250 E
- 1474 N 285 E
- 398 Paul Ave
- 1837 N 440 W
- 1908 N 200 W
- 1366 N Main St Unit 5
- 2044 Evans Cove Loop
- 2053 Evans Cove Loop Unit 39
- 2048 Evans Cove Loop
- 937 Rainbow Dr
- 495 Spurlock St
- 480 Spurlock St
- 785 Sherwood Dr
- 9 W 2150 N