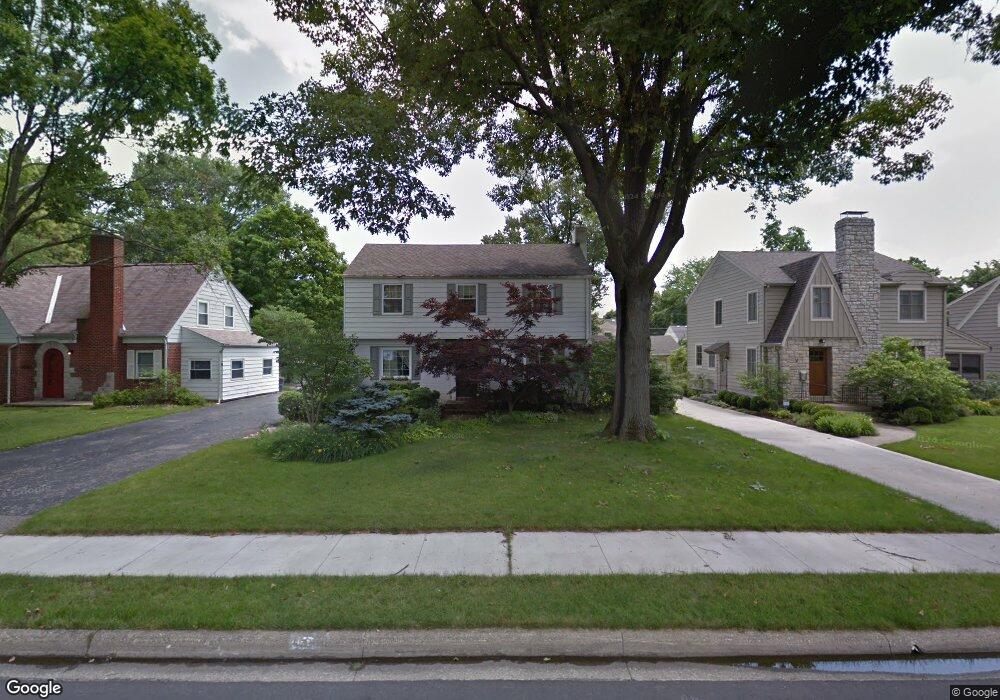
1940 Glenn Ave Columbus, OH 43212
Estimated Value: $565,000 - $688,979
3
Beds
2
Baths
1,822
Sq Ft
$345/Sq Ft
Est. Value
About This Home
This home is located at 1940 Glenn Ave, Columbus, OH 43212 and is currently estimated at $628,245, approximately $344 per square foot. 1940 Glenn Ave is a home located in Franklin County with nearby schools including Barrington Road Elementary School, Jones Middle School, and Upper Arlington High School.
Ownership History
Date
Name
Owned For
Owner Type
Purchase Details
Closed on
Jul 26, 2024
Sold by
Yang Huanxing
Bought by
Jing Xin
Current Estimated Value
Purchase Details
Closed on
Jul 29, 2005
Sold by
Parmater Andrew J and Parmater Kimberly S
Bought by
Xin Yang Huanxing and Xin Jing
Purchase Details
Closed on
Sep 8, 1999
Sold by
Seimer James M and Seimer Sherry A
Bought by
Parmater Andrew J and Parmater Kimberly S
Home Financials for this Owner
Home Financials are based on the most recent Mortgage that was taken out on this home.
Original Mortgage
$210,150
Interest Rate
6.87%
Purchase Details
Closed on
Jul 2, 1976
Bought by
Seimer James M
Create a Home Valuation Report for This Property
The Home Valuation Report is an in-depth analysis detailing your home's value as well as a comparison with similar homes in the area
Home Values in the Area
Average Home Value in this Area
Purchase History
| Date | Buyer | Sale Price | Title Company |
|---|---|---|---|
| Jing Xin | -- | None Listed On Document | |
| Xin Yang Huanxing | $309,000 | Chicago Tit | |
| Parmater Andrew J | $233,500 | Celtic Title Agency Inc | |
| Seimer James M | -- | -- |
Source: Public Records
Mortgage History
| Date | Status | Borrower | Loan Amount |
|---|---|---|---|
| Previous Owner | Parmater Andrew J | $210,150 |
Source: Public Records
Tax History
| Year | Tax Paid | Tax Assessment Tax Assessment Total Assessment is a certain percentage of the fair market value that is determined by local assessors to be the total taxable value of land and additions on the property. | Land | Improvement |
|---|---|---|---|---|
| 2025 | $13,313 | $225,300 | $110,180 | $115,120 |
| 2024 | $13,313 | $225,300 | $110,180 | $115,120 |
| 2023 | $13,281 | $225,295 | $110,180 | $115,115 |
| 2022 | $9,409 | $134,650 | $40,080 | $94,570 |
| 2021 | $8,411 | $134,650 | $40,080 | $94,570 |
| 2020 | $8,569 | $134,650 | $40,080 | $94,570 |
| 2019 | $8,203 | $118,100 | $40,080 | $78,020 |
| 2018 | $7,566 | $118,100 | $40,080 | $78,020 |
| 2017 | $7,685 | $118,100 | $40,080 | $78,020 |
| 2016 | $7,119 | $105,780 | $32,380 | $73,400 |
| 2015 | $6,988 | $105,780 | $32,380 | $73,400 |
| 2014 | $6,996 | $105,780 | $32,380 | $73,400 |
| 2013 | $3,340 | $96,145 | $29,435 | $66,710 |
Source: Public Records
Map
Nearby Homes
- 2000 Northwest Blvd Unit D
- 1810 Ashland Ave
- 1785 Northwest Ct Unit D
- 1835 Northwest Ct Unit 141
- 1799 Kings Ct Unit B
- 1507 Chesapeake Ave
- 1493 Chesapeake Ave
- 1624 Ashland Ave
- 1606 Elmwood Ave
- 1565 Berkshire Rd
- 1869 Tewksbury Rd
- 2031 Concord Rd
- 1523 Wyandotte Rd
- 1500 Fairview Ave
- 2015 W 5th Ave Unit 211
- 2015 W 5th Ave Unit 102
- 2015 W 5th Ave Unit 108
- 00 W 7th Ave
- 1579 Arlington Ave Unit 1579B
- 1631 Roxbury Rd Unit A1
- 1948 Glenn Ave
- 1932 Glenn Ave
- 1924 Glenn Ave
- 1935 Westwood Ave
- 1927 Westwood Ave
- 1943 Westwood Ave
- 1962 Glenn Ave
- 1919 Westwood Ave
- 1916 Glenn Ave
- 1943 Glenn Ave
- 1935 Glenn Ave
- 1951 Westwood Ave
- 1951 Glenn Ave
- 1927 Glenn Ave
- 1911 Westwood Ave
- 1970 Glenn Ave
- 1908 Glenn Ave
- 1959 Glenn Ave
- 1919 Glenn Ave
- 1903 Westwood Ave
Your Personal Tour Guide
Ask me questions while you tour the home.