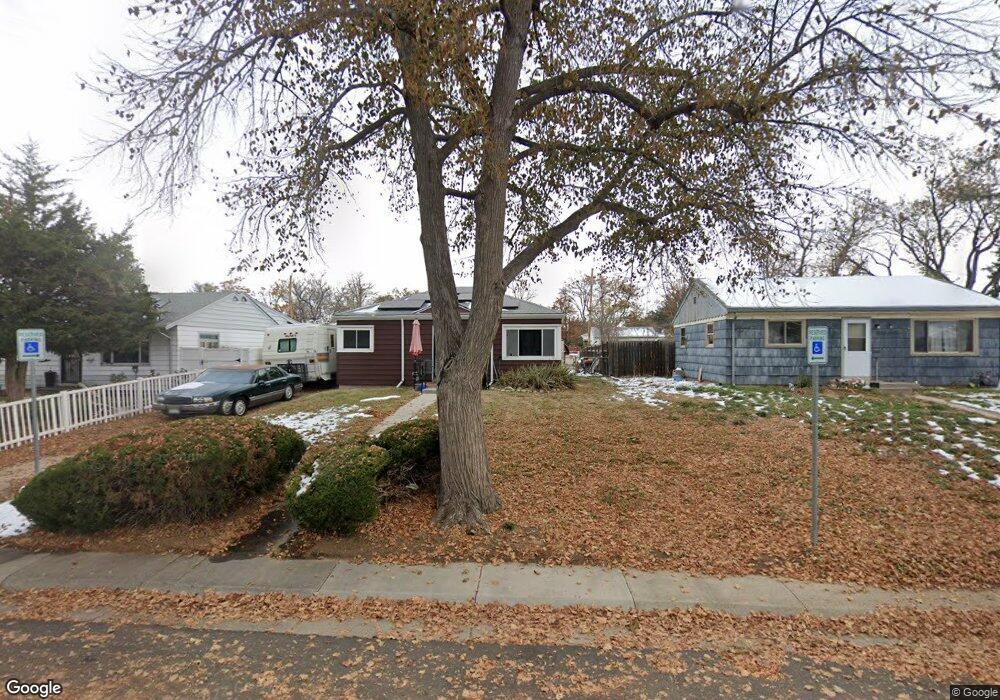
1940 Lansing St Aurora, CO 80010
North Aurora NeighborhoodEstimated Value: $315,185 - $358,000
2
Beds
1
Bath
720
Sq Ft
$474/Sq Ft
Est. Value
About This Home
This home is located at 1940 Lansing St, Aurora, CO 80010 and is currently estimated at $341,046, approximately $473 per square foot. 1940 Lansing St is a home located in Adams County with nearby schools including Montview Elementary School, North Middle School Health Sciences & Technology, and Aurora Central High School.
Ownership History
Date
Name
Owned For
Owner Type
Purchase Details
Closed on
Aug 17, 2005
Sold by
Cisneros Anthony Vernon
Bought by
Cisneros Anthony Vernon
Current Estimated Value
Home Financials for this Owner
Home Financials are based on the most recent Mortgage that was taken out on this home.
Original Mortgage
$47,000
Interest Rate
5.78%
Mortgage Type
New Conventional
Create a Home Valuation Report for This Property
The Home Valuation Report is an in-depth analysis detailing your home's value as well as a comparison with similar homes in the area
Home Values in the Area
Average Home Value in this Area
Purchase History
| Date | Buyer | Sale Price | Title Company |
|---|---|---|---|
| Cisneros Anthony Vernon | -- | Chicago Title Co |
Source: Public Records
Mortgage History
| Date | Status | Borrower | Loan Amount |
|---|---|---|---|
| Closed | Cisneros Anthony Vernon | $47,000 |
Source: Public Records
Tax History
| Year | Tax Paid | Tax Assessment Tax Assessment Total Assessment is a certain percentage of the fair market value that is determined by local assessors to be the total taxable value of land and additions on the property. | Land | Improvement |
|---|---|---|---|---|
| 2025 | $1,319 | $22,240 | $5,440 | $16,800 |
| 2024 | $1,319 | $20,440 | $5,000 | $15,440 |
| 2023 | $1,340 | $23,070 | $5,210 | $17,860 |
| 2022 | $1,533 | $20,440 | $5,350 | $15,090 |
| 2021 | $1,597 | $20,440 | $5,350 | $15,090 |
| 2020 | $1,595 | $20,670 | $5,510 | $15,160 |
| 2019 | $1,593 | $20,670 | $5,510 | $15,160 |
| 2018 | $789 | $13,350 | $4,320 | $9,030 |
| 2017 | $701 | $13,350 | $4,320 | $9,030 |
| 2016 | $499 | $9,410 | $2,550 | $6,860 |
| 2015 | $483 | $4,700 | $1,270 | $3,430 |
| 2014 | $389 | $3,740 | $960 | $2,780 |
Source: Public Records
Map
Nearby Homes
- 1732 Lansing St
- 2045 Lima St
- 1902 Kenton St
- 11087 Montview Blvd
- 1764 Newark St
- 2209 Macon St
- 1945 Nome St
- 1741 Joliet St
- 1680 Newark St
- 1781 N Oakland St
- 1745 Jamaica St
- 2025 Ironton St
- 1764 Oswego St
- 1605 Oakland St
- 2057 Ironton St
- 1671 Oswego St
- 2241 Ironton St
- 2300 Ironton St
- 2341 Oakland St
- 2381 Nome St
Your Personal Tour Guide
Ask me questions while you tour the home.