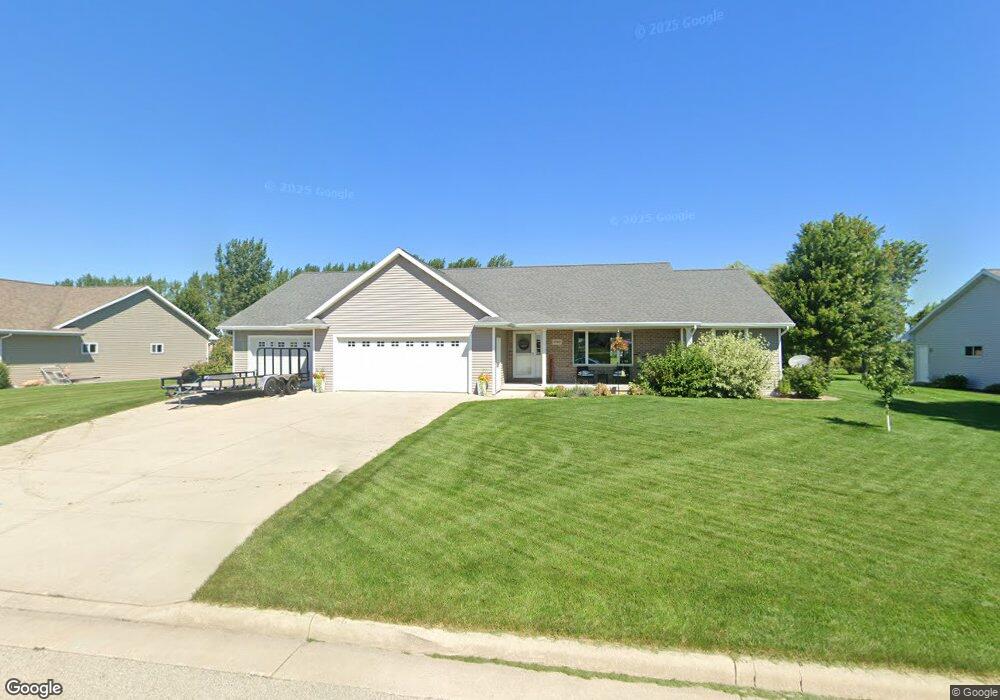
1940 Sinclair Dr de Pere, WI 54115
Estimated Value: $466,643 - $511,000
3
Beds
2
Baths
1,704
Sq Ft
$283/Sq Ft
Est. Value
About This Home
This home is located at 1940 Sinclair Dr, de Pere, WI 54115 and is currently estimated at $482,661, approximately $283 per square foot. 1940 Sinclair Dr is a home located in Brown County with nearby schools including Hemlock Creek Elementary School, West De Pere Middle School, and West De Pere High School.
Ownership History
Date
Name
Owned For
Owner Type
Purchase Details
Closed on
Oct 21, 2024
Sold by
Vanlanen Jacob and Vanlanen Van Lanen
Bought by
Vanlanen Jessica and Vanlanen Y
Current Estimated Value
Purchase Details
Closed on
Oct 5, 2016
Sold by
Geffers Derek and Geffers Sara B
Bought by
Vanlanen Jacob Van and Vanlanen Jessica Van
Home Financials for this Owner
Home Financials are based on the most recent Mortgage that was taken out on this home.
Original Mortgage
$252,700
Interest Rate
3.46%
Mortgage Type
New Conventional
Purchase Details
Closed on
Jul 25, 2009
Sold by
Ronald J Sinclair Construction Llc
Bought by
Geffers Derek and Geffers Sara B
Home Financials for this Owner
Home Financials are based on the most recent Mortgage that was taken out on this home.
Original Mortgage
$185,100
Interest Rate
5.43%
Mortgage Type
New Conventional
Create a Home Valuation Report for This Property
The Home Valuation Report is an in-depth analysis detailing your home's value as well as a comparison with similar homes in the area
Home Values in the Area
Average Home Value in this Area
Purchase History
| Date | Buyer | Sale Price | Title Company |
|---|---|---|---|
| Vanlanen Jessica | -- | -- | |
| Vanlanen Jacob Van | $266,000 | Knight Barry Title Services | |
| Geffers Derek | $205,800 | Evans Title |
Source: Public Records
Mortgage History
| Date | Status | Borrower | Loan Amount |
|---|---|---|---|
| Previous Owner | Vanlanen Jacob Van | $252,700 | |
| Previous Owner | Geffers Derek | $185,100 |
Source: Public Records
Tax History
| Year | Tax Paid | Tax Assessment Tax Assessment Total Assessment is a certain percentage of the fair market value that is determined by local assessors to be the total taxable value of land and additions on the property. | Land | Improvement |
|---|---|---|---|---|
| 2025 | $4,556 | $297,200 | $73,700 | $223,500 |
| 2024 | $4,324 | $297,200 | $73,700 | $223,500 |
| 2023 | $3,975 | $297,200 | $73,700 | $223,500 |
| 2022 | $3,990 | $297,200 | $73,700 | $223,500 |
| 2021 | $4,003 | $297,200 | $73,700 | $223,500 |
| 2020 | $3,889 | $206,400 | $44,000 | $162,400 |
| 2019 | $3,832 | $206,400 | $44,000 | $162,400 |
| 2018 | $3,664 | $206,400 | $44,000 | $162,400 |
| 2017 | $3,726 | $206,400 | $44,000 | $162,400 |
| 2016 | $3,765 | $206,400 | $44,000 | $162,400 |
| 2015 | $3,831 | $206,400 | $44,000 | $162,400 |
| 2014 | $3,995 | $206,400 | $44,000 | $162,400 |
| 2013 | $3,995 | $206,400 | $44,000 | $162,400 |
Source: Public Records
Map
Nearby Homes
- 1972 Sinclair Dr
- 1924 Andraya Ln
- 1319 Pond View Cir Unit 59
- 1242 Pond View Cir Unit 18
- 1267 Pond View Cir Unit 42
- 1843 Sandy Springs Rd
- 3740 Edwina Dr
- 2017 Morning Dew Ln
- 3706 Edwina Dr
- 1350 Copilot Way
- 1468 Divinity Dr
- 1417 Crossroads Dr
- 3763 Edwina Dr
- 1405 Crossroads Dr
- 1378 Crossroads Dr
- 1457 Divinity Dr
- 1451 Divinity Dr
- 3705 Edwina Dr
- 1439 Divinity Dr
- 1421 Divinity Dr
- 1932 Sinclair Dr
- 1948 Sinclair Dr
- 1956 Sinclair Dr
- 1951 Sinclair Dr
- 1924 Sinclair Dr
- 1935 Sinclair Dr
- 1927 Sinclair Dr
- 1919 Sinclair Dr
- 1964 Sinclair Dr
- 1916 Sinclair Dr
- 1959 Sinclair Dr
- 1426 Honor Way
- 1427 Honor Way
- 1425 Pat Tillman St
- 1913 Sinclair Dr
- 1400 Quarry Park Dr
- 1908 Sinclair Dr
- 1432 Honor Way
- 1420 Pat Tillman St
- 1431 Pat Tillman St
Your Personal Tour Guide
Ask me questions while you tour the home.