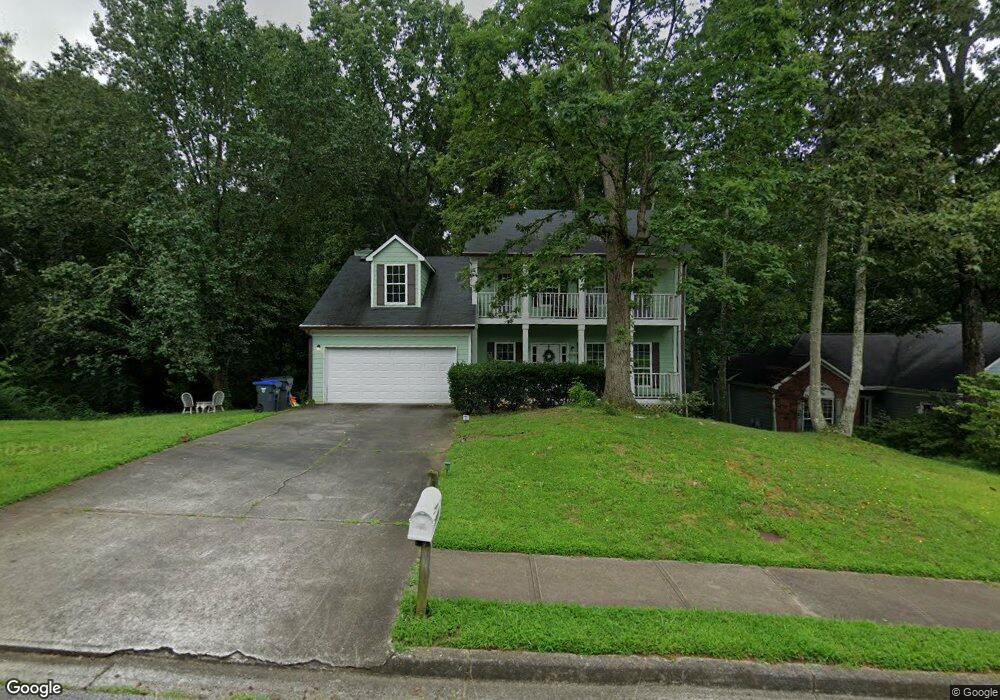
1940 Stone Forest Dr Unit 53 Lawrenceville, GA 30043
Estimated Value: $387,095 - $402,000
4
Beds
3
Baths
2,040
Sq Ft
$193/Sq Ft
Est. Value
About This Home
This home is located at 1940 Stone Forest Dr Unit 53, Lawrenceville, GA 30043 and is currently estimated at $394,524, approximately $193 per square foot. 1940 Stone Forest Dr Unit 53 is a home located in Gwinnett County with nearby schools including Taylor Elementary School, Creekland Middle School, and Collins Hill High School.
Ownership History
Date
Name
Owned For
Owner Type
Purchase Details
Closed on
Oct 16, 2018
Sold by
Greater Metro Investment Grp Llc
Bought by
Ramsey Jermaine L and Ramsey Brooke A
Current Estimated Value
Home Financials for this Owner
Home Financials are based on the most recent Mortgage that was taken out on this home.
Original Mortgage
$220,924
Outstanding Balance
$195,133
Interest Rate
5.12%
Mortgage Type
FHA
Estimated Equity
$199,391
Purchase Details
Closed on
Feb 16, 2018
Sold by
Greater Metro Investment G
Bought by
Greater Metro Investment Grp L
Purchase Details
Closed on
Aug 16, 1995
Sold by
Wagner Kenneth Angela
Bought by
Putirskis Paul T Katherine
Create a Home Valuation Report for This Property
The Home Valuation Report is an in-depth analysis detailing your home's value as well as a comparison with similar homes in the area
Home Values in the Area
Average Home Value in this Area
Purchase History
| Date | Buyer | Sale Price | Title Company |
|---|---|---|---|
| Ramsey Jermaine L | $225,000 | -- | |
| Greater Metro Investment Grp L | -- | -- | |
| Greater Metro Investment Grp L | $150,000 | -- | |
| Putirskis Paul T Katherine | $121,000 | -- |
Source: Public Records
Mortgage History
| Date | Status | Borrower | Loan Amount |
|---|---|---|---|
| Open | Ramsey Jermaine L | $220,924 | |
| Closed | Putirskis Paul T Katherine | $0 |
Source: Public Records
Tax History Compared to Growth
Tax History
| Year | Tax Paid | Tax Assessment Tax Assessment Total Assessment is a certain percentage of the fair market value that is determined by local assessors to be the total taxable value of land and additions on the property. | Land | Improvement |
|---|---|---|---|---|
| 2024 | $4,338 | $150,840 | $31,200 | $119,640 |
| 2023 | $4,338 | $162,440 | $28,000 | $134,440 |
| 2022 | $4,103 | $141,160 | $22,000 | $119,160 |
| 2021 | $3,225 | $96,640 | $17,200 | $79,440 |
| 2020 | $3,247 | $96,640 | $17,200 | $79,440 |
| 2019 | $2,809 | $71,000 | $12,400 | $58,600 |
| 2018 | $2,599 | $71,000 | $12,400 | $58,600 |
| 2016 | $2,620 | $71,000 | $12,400 | $58,600 |
| 2015 | $2,417 | $64,560 | $12,400 | $52,160 |
| 2014 | -- | $64,560 | $12,400 | $52,160 |
Source: Public Records
Map
Nearby Homes
- 2050 Fortuna St
- 1955 Watson Falls Ct
- 1930 Collins Hill Rd
- 1870 Wildcat Trace Cir
- 260 Wildcat Lake Dr
- 12 Jacobs Farm Ln Unit 6
- 340 Rosedown Way
- 1931 Abinger Way
- 83 Russell Rd
- 81 Russell Rd
- 1832 Shores Ridge Ct
- 2135 Saint Thomas Way
- 1909 McLennon Ct
- 275 Rose Ivy Ct
- 2012 Little River Dr Unit 1
- 1767 Tidewell Trace
- 1940 Stone Forest Dr
- 1940 Stone Forest Dr
- 1950 Stone Forest Dr
- 1930 Stone Forest Dr
- 0 Stone Forest Dr Unit 8634477
- 0 Stone Forest Dr Unit 8612327
- 0 Stone Forest Dr Unit 8513452
- 0 Stone Forest Dr Unit 8235688
- 0 Stone Forest Dr Unit 9076326
- 0 Stone Forest Dr Unit 8881784
- 0 Stone Forest Dr Unit 3086980
- 0 Stone Forest Dr Unit 3109317
- 0 Stone Forest Dr Unit 3195906
- 0 Stone Forest Dr Unit 3234197
- 0 Stone Forest Dr Unit 3243348
- 0 Stone Forest Dr Unit 3248888
- 0 Stone Forest Dr Unit 7066609
- 0 Stone Forest Dr Unit 7107819
- 0 Stone Forest Dr Unit 7212113
- 0 Stone Forest Dr Unit 7347664