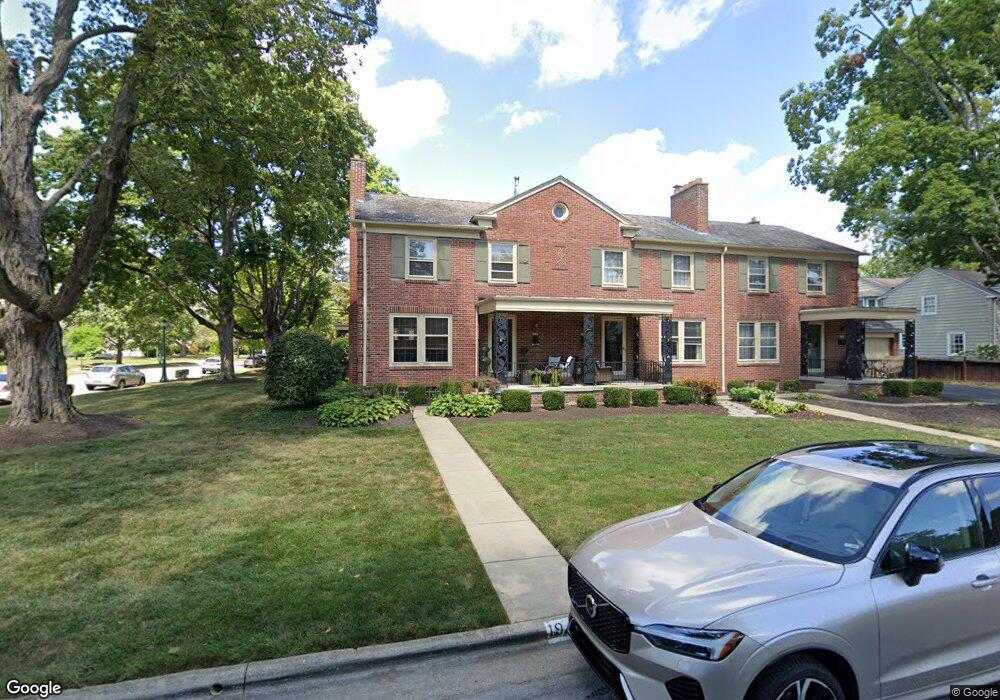
1940 Suffolk Rd Unit 1940 Columbus, OH 43221
Estimated Value: $291,000 - $360,000
2
Beds
1
Bath
1,120
Sq Ft
$298/Sq Ft
Est. Value
About This Home
This home is located at 1940 Suffolk Rd Unit 1940, Columbus, OH 43221 and is currently estimated at $333,967, approximately $298 per square foot. 1940 Suffolk Rd Unit 1940 is a home located in Franklin County with nearby schools including Barrington Road Elementary School, Jones Middle School, and Upper Arlington High School.
Ownership History
Date
Name
Owned For
Owner Type
Purchase Details
Closed on
Jun 20, 2007
Sold by
Martin Chad G and Martin Karlye M
Bought by
Miller Christine A
Current Estimated Value
Home Financials for this Owner
Home Financials are based on the most recent Mortgage that was taken out on this home.
Original Mortgage
$207,575
Outstanding Balance
$128,247
Interest Rate
6.37%
Mortgage Type
Purchase Money Mortgage
Estimated Equity
$205,720
Purchase Details
Closed on
Jul 20, 1999
Sold by
Redenbarger Bonnie E and Star Bank Na
Bought by
Martin Chad G
Purchase Details
Closed on
Sep 1, 1993
Bought by
Redenbarger Bonnie E
Purchase Details
Closed on
May 16, 1991
Purchase Details
Closed on
Nov 2, 1988
Create a Home Valuation Report for This Property
The Home Valuation Report is an in-depth analysis detailing your home's value as well as a comparison with similar homes in the area
Home Values in the Area
Average Home Value in this Area
Purchase History
| Date | Buyer | Sale Price | Title Company |
|---|---|---|---|
| Miller Christine A | $218,500 | Cornerstone Title Agency Llc | |
| Martin Chad G | $89,100 | -- | |
| Redenbarger Bonnie E | $86,000 | -- | |
| -- | $68,900 | -- | |
| -- | $65,400 | -- |
Source: Public Records
Mortgage History
| Date | Status | Borrower | Loan Amount |
|---|---|---|---|
| Open | Miller Christine A | $207,575 |
Source: Public Records
Tax History Compared to Growth
Tax History
| Year | Tax Paid | Tax Assessment Tax Assessment Total Assessment is a certain percentage of the fair market value that is determined by local assessors to be the total taxable value of land and additions on the property. | Land | Improvement |
|---|---|---|---|---|
| 2024 | $5,913 | $102,130 | $24,500 | $77,630 |
| 2023 | $6,255 | $102,130 | $24,500 | $77,630 |
| 2022 | $5,790 | $80,610 | $24,150 | $56,460 |
| 2021 | $5,317 | $80,610 | $24,150 | $56,460 |
| 2020 | $5,272 | $80,610 | $24,150 | $56,460 |
| 2019 | $4,859 | $70,070 | $21,000 | $49,070 |
| 2018 | $4,465 | $70,070 | $21,000 | $49,070 |
| 2017 | $4,392 | $70,070 | $21,000 | $49,070 |
| 2016 | $3,912 | $58,420 | $14,530 | $43,890 |
| 2015 | $3,909 | $58,420 | $14,530 | $43,890 |
| 2014 | $3,864 | $58,420 | $14,530 | $43,890 |
| 2013 | $2,054 | $58,415 | $14,525 | $43,890 |
Source: Public Records
Map
Nearby Homes
- 1932 Suffolk Rd Unit 1932
- 2063 Westover Rd
- 2276 Northwest Blvd
- 2110 Northwest Blvd
- 1934 Bedford Rd
- 2295 Oxford Rd
- 1565 Berkshire Rd
- 2593 Coventry Rd
- 1535 Doone Rd
- 2569 Chester Rd
- 2615 Northwest Blvd
- 2585 Westmont Blvd
- 1488 Essex Rd
- 1481 Doone Rd
- 1470 Cardiff Rd
- 2648 Chester Rd
- 1550 College Hill Dr
- 1659 Tremont Rd
- 1733 Elmwood Ave
- 1729 Elmwood Ave
- 1938 Suffolk Rd Unit 1938
- 2240 Coventry Rd Unit 2240
- 2244 Coventry Rd Unit 2244
- 1926 Suffolk Rd
- 2212 Coventry Rd Unit 216
- 1921 Suffolk Rd
- 2229 Coventry Rd Unit 3
- 2229 Coventry Rd Unit 6
- 2229 Coventry Rd Unit 5
- 2229 Coventry Rd Unit 4
- 2229 Coventry Rd
- 2229 Coventry Rd Unit 1
- 1918 Suffolk Rd
- 1943 Tewksbury Rd Unit 945
- 1937 Tewksbury Rd
- 1917 Suffolk Rd
- 0 Suffolk Rd
- 1960 Suffolk Rd
- 1962 Suffolk Rd Unit 1962
- 1910 Suffolk Rd