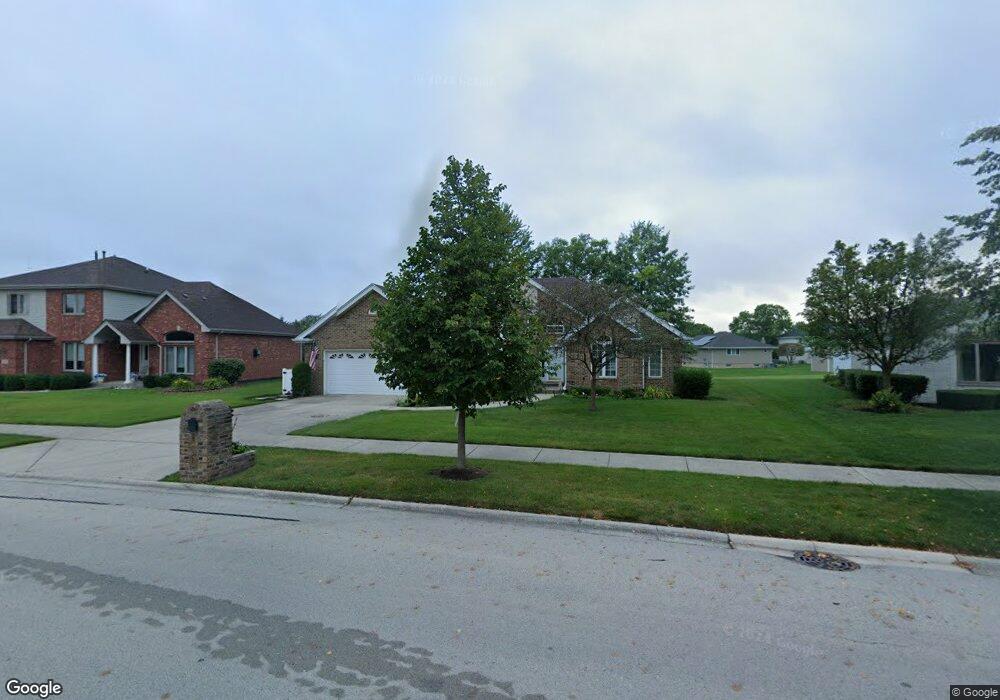
19400 Everett Ln Unit 3A Mokena, IL 60448
Estimated Value: $454,000 - $536,000
4
Beds
4
Baths
2,193
Sq Ft
$229/Sq Ft
Est. Value
About This Home
This home is located at 19400 Everett Ln Unit 3A, Mokena, IL 60448 and is currently estimated at $502,778, approximately $229 per square foot. 19400 Everett Ln Unit 3A is a home located in Will County with nearby schools including Arbury Hills Elementary School, Summit Hill Junior High School, and Lincoln-Way East High School.
Ownership History
Date
Name
Owned For
Owner Type
Purchase Details
Closed on
Aug 25, 2023
Sold by
Gorman Donna J and Gorman Philip J
Bought by
Donna J Gorman And Philip J Gorman Living Tru and Gorman
Current Estimated Value
Purchase Details
Closed on
Oct 16, 1998
Sold by
Cole Taylor Bank
Bought by
Gorman Philip J and Gorman Donna Jo
Home Financials for this Owner
Home Financials are based on the most recent Mortgage that was taken out on this home.
Original Mortgage
$181,600
Interest Rate
6.72%
Purchase Details
Closed on
Mar 3, 1994
Sold by
Marquette National Bank
Bought by
Cole Taylor Bank
Home Financials for this Owner
Home Financials are based on the most recent Mortgage that was taken out on this home.
Original Mortgage
$300,000
Interest Rate
7.04%
Create a Home Valuation Report for This Property
The Home Valuation Report is an in-depth analysis detailing your home's value as well as a comparison with similar homes in the area
Home Values in the Area
Average Home Value in this Area
Purchase History
| Date | Buyer | Sale Price | Title Company |
|---|---|---|---|
| Donna J Gorman And Philip J Gorman Living Tru | -- | Fidelity National Title | |
| Gorman Philip J | $227,000 | Chicago Title Insurance Co | |
| Cole Taylor Bank | -- | Chicago Title Insurance Co |
Source: Public Records
Mortgage History
| Date | Status | Borrower | Loan Amount |
|---|---|---|---|
| Previous Owner | Gorman Philip J | $181,600 | |
| Previous Owner | Cole Taylor Bank | $300,000 |
Source: Public Records
Tax History
| Year | Tax Paid | Tax Assessment Tax Assessment Total Assessment is a certain percentage of the fair market value that is determined by local assessors to be the total taxable value of land and additions on the property. | Land | Improvement |
|---|---|---|---|---|
| 2024 | $12,813 | $154,169 | $36,042 | $118,127 |
| 2023 | $12,813 | $137,688 | $32,189 | $105,499 |
| 2022 | $11,295 | $125,411 | $29,319 | $96,092 |
| 2021 | $10,592 | $117,327 | $27,429 | $89,898 |
| 2020 | $10,344 | $114,020 | $26,656 | $87,364 |
| 2019 | $10,009 | $110,969 | $25,943 | $85,026 |
| 2018 | $9,654 | $107,779 | $25,197 | $82,582 |
| 2017 | $9,446 | $105,263 | $24,609 | $80,654 |
| 2016 | $9,158 | $101,654 | $23,765 | $77,889 |
| 2015 | $8,803 | $98,074 | $22,928 | $75,146 |
| 2014 | $8,803 | $97,393 | $22,769 | $74,624 |
| 2013 | $8,803 | $98,656 | $23,064 | $75,592 |
Source: Public Records
Map
Nearby Homes
- 19415 Manchester Dr
- 9920 Sussex Ct
- 19300 S La Grange Rd
- 9860 Stafford Ct
- 19246 104th Ave Unit 19246
- 19207 104th Ave
- 10521 Thornham Ln Unit 10521
- 9885 Cambridge Ct Unit B
- 19060 Everett Blvd
- 9425 Pine St
- 9446 Magnolia Ave
- 19410 Fiona Ave
- Lots 4,5, & 6 191st St
- Vacant 191st St
- 19758 Sunset Ct
- 19099 Hickory Creek Dr
- Lot 22 Hickory Creek Dr
- 10646 Willow Ave
- 19602 Swanberg Ln
- 10508 W La Porte Rd
- 19356 Everett Ln
- 19418 Everett Ln
- 19426 Everett Ln
- 19348 Everett Ln Unit 3A
- 19401 Everett Ln
- 19415 Stonehenge Dr
- 19417 Everett Ln
- 19357 Stonehenge Dr
- 19353 Everett Ln Unit 3B
- 19425 Stonehenge Dr
- 19434 Everett Ln
- 19340 Everett Ln
- 19349 Stonehenge Dr
- 19347 Everett Ln
- 19433 Everett Ln
- 19332 Mansfield Ln
- 19444 Everett Ln Unit 3A
- 19402 York Dr
- 19426 York Dr
Your Personal Tour Guide
Ask me questions while you tour the home.