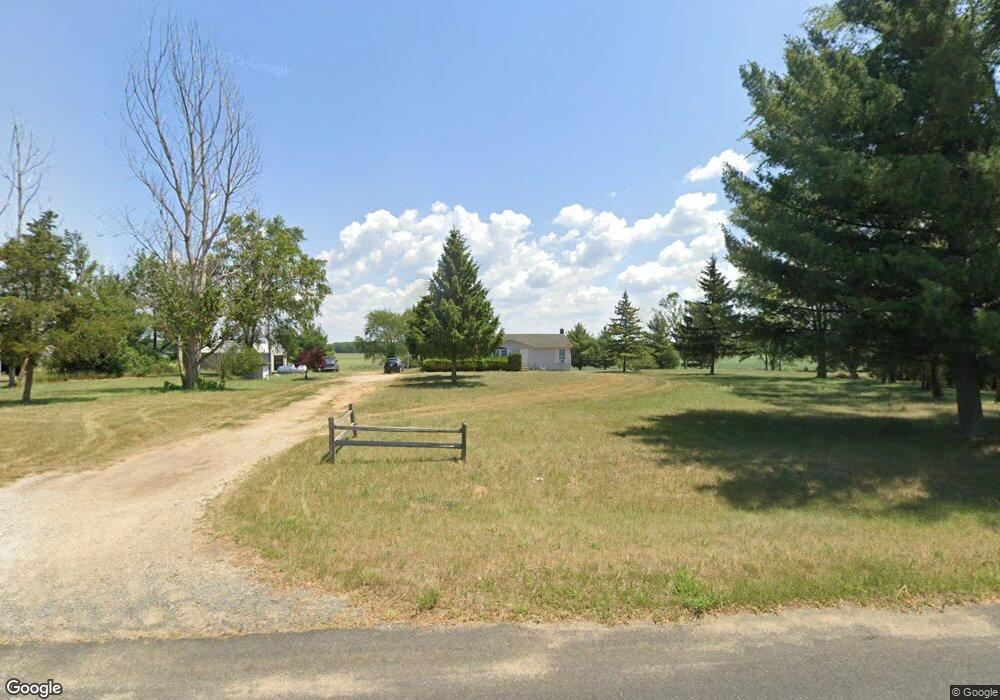
1941 55th St Fennville, MI 49408
Estimated Value: $200,000 - $280,000
3
Beds
2
Baths
1,352
Sq Ft
$182/Sq Ft
Est. Value
About This Home
This home is located at 1941 55th St, Fennville, MI 49408 and is currently estimated at $246,667, approximately $182 per square foot. 1941 55th St is a home located in Allegan County with nearby schools including Fennville Elementary School, Fennville Middle School, and Fennville High School.
Ownership History
Date
Name
Owned For
Owner Type
Purchase Details
Closed on
Jan 22, 2009
Sold by
Trott & Trott Pc
Bought by
Barnes Rhonda
Current Estimated Value
Purchase Details
Closed on
Sep 21, 2006
Sold by
Vredeveld Nancy J
Bought by
Federal National Mortgage Association
Purchase Details
Closed on
Apr 16, 1999
Sold by
Karafa Kenneth
Bought by
Vredeveld Nancy
Purchase Details
Closed on
Dec 12, 1996
Sold by
Morse Levi C and Morse Theresa A
Bought by
Karafa Kenneth
Create a Home Valuation Report for This Property
The Home Valuation Report is an in-depth analysis detailing your home's value as well as a comparison with similar homes in the area
Home Values in the Area
Average Home Value in this Area
Purchase History
| Date | Buyer | Sale Price | Title Company |
|---|---|---|---|
| Barnes Rhonda | $38,000 | Warranty Title Agency Llc | |
| Federal National Mortgage Association | $96,013 | None Available | |
| Vredeveld Nancy | $89,900 | -- | |
| Karafa Kenneth | $79,500 | -- |
Source: Public Records
Tax History Compared to Growth
Tax History
| Year | Tax Paid | Tax Assessment Tax Assessment Total Assessment is a certain percentage of the fair market value that is determined by local assessors to be the total taxable value of land and additions on the property. | Land | Improvement |
|---|---|---|---|---|
| 2025 | $1,453 | $104,100 | $15,700 | $88,400 |
| 2024 | $1,167 | $83,000 | $14,300 | $68,700 |
| 2023 | $1,167 | $84,000 | $13,600 | $70,400 |
| 2022 | $1,167 | $76,000 | $11,200 | $64,800 |
| 2021 | $1,057 | $72,600 | $10,100 | $62,500 |
| 2020 | $1,057 | $64,500 | $9,600 | $54,900 |
| 2019 | $1,057 | $58,300 | $8,700 | $49,600 |
| 2018 | $1,057 | $48,800 | $7,700 | $41,100 |
| 2017 | $0 | $48,400 | $7,200 | $41,200 |
| 2016 | $0 | $35,600 | $6,500 | $29,100 |
| 2015 | -- | $35,600 | $6,500 | $29,100 |
| 2014 | -- | $35,100 | $7,000 | $28,100 |
| 2013 | -- | $31,900 | $7,000 | $24,900 |
Source: Public Records
Map
Nearby Homes