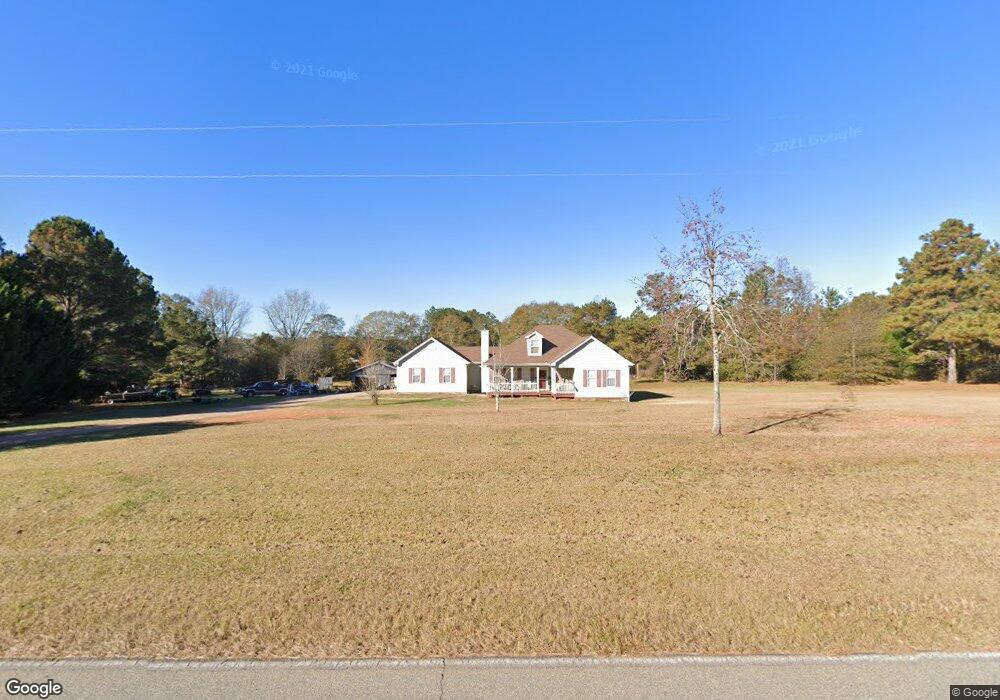
1941 Fears Rd Rutledge, GA 30663
Estimated Value: $323,230 - $349,000
3
Beds
3
Baths
1,344
Sq Ft
$249/Sq Ft
Est. Value
About This Home
This home is located at 1941 Fears Rd, Rutledge, GA 30663 and is currently estimated at $334,077, approximately $248 per square foot. 1941 Fears Rd is a home located in Morgan County with nearby schools including Morgan County Primary School, Morgan County Elementary School, and Morgan County Middle School.
Ownership History
Date
Name
Owned For
Owner Type
Purchase Details
Closed on
Oct 4, 2005
Sold by
Hicks Michael
Bought by
Hicks Tommy and Hicks Rebecca
Current Estimated Value
Home Financials for this Owner
Home Financials are based on the most recent Mortgage that was taken out on this home.
Original Mortgage
$130,000
Outstanding Balance
$67,862
Interest Rate
5.66%
Mortgage Type
New Conventional
Estimated Equity
$266,215
Purchase Details
Closed on
Nov 19, 2002
Sold by
Hicks Tina
Bought by
Hicks Michael
Purchase Details
Closed on
Aug 5, 2002
Sold by
Fv-1 Inc
Bought by
Hicks Tina
Purchase Details
Closed on
Mar 20, 2002
Sold by
Cantrell Ronnie
Bought by
Equicredit Coproration Of America
Purchase Details
Closed on
Feb 15, 1999
Sold by
Shumate Charles
Bought by
Cantrell Ronnie
Purchase Details
Closed on
Dec 6, 1995
Sold by
Jones Alice S
Bought by
Shumate Charles
Create a Home Valuation Report for This Property
The Home Valuation Report is an in-depth analysis detailing your home's value as well as a comparison with similar homes in the area
Home Values in the Area
Average Home Value in this Area
Purchase History
| Date | Buyer | Sale Price | Title Company |
|---|---|---|---|
| Hicks Tommy | $130,000 | -- | |
| Hicks Michael | -- | -- | |
| Hicks Tina | $107,000 | -- | |
| Fv-1 Inc | $107,000 | -- | |
| Equicredit Coproration Of America | -- | -- | |
| Cantrell Ronnie | $95,900 | -- | |
| Shumate Charles | $15,000 | -- |
Source: Public Records
Mortgage History
| Date | Status | Borrower | Loan Amount |
|---|---|---|---|
| Open | Hicks Tommy | $130,000 |
Source: Public Records
Tax History
| Year | Tax Paid | Tax Assessment Tax Assessment Total Assessment is a certain percentage of the fair market value that is determined by local assessors to be the total taxable value of land and additions on the property. | Land | Improvement |
|---|---|---|---|---|
| 2025 | $1,742 | $102,885 | $24,720 | $78,165 |
| 2024 | $1,676 | $75,580 | $15,006 | $60,574 |
| 2023 | $1,566 | $68,637 | $13,840 | $54,797 |
| 2022 | $1,563 | $65,890 | $13,840 | $52,050 |
| 2021 | $1,551 | $65,151 | $13,840 | $51,311 |
| 2020 | $1,530 | $63,706 | $13,840 | $49,866 |
| 2019 | $1,555 | $63,706 | $13,840 | $49,866 |
| 2018 | $1,555 | $62,825 | $12,959 | $49,866 |
| 2017 | $1,610 | $62,164 | $12,959 | $49,205 |
| 2016 | $1,438 | $56,343 | $12,582 | $43,761 |
| 2015 | $1,498 | $57,908 | $12,080 | $45,828 |
| 2014 | $1,307 | $52,144 | $12,760 | $39,384 |
| 2013 | -- | $36,800 | $11,080 | $25,720 |
Source: Public Records
Map
Nearby Homes
- 00 Fears Rd
- 00 Fears Rd
- 1760 Fears Rd
- 0 Fears Rd Unit 10569285
- 3641 Davis Academy Rd
- 3195 Davis Academy Rd
- 2470 Fears Rd
- 0 Fears Rd Unit 10647993
- 0 Fears Rd Unit 7684722
- 0 Fears Rd Unit 26394214
- 0 Fears Rd Unit CL344239
- 0 Fears Rd Unit 69810
- 0 Fears Rd Unit 10647985
- 1150 Harris Hollis Ln
- 1031 Graham Dr
- 1041 Cooper Ln
- 0 W Dixie Hwy Unit 10499573
- 1310 Deerwood Dr
- 0 Dickson Rd Unit 70092
- 1061 Shoals Ct
- 1971 Fears Rd
- 1940 Fears Rd
- 2970 Davis Academy Rd
- 1851 Fears Rd
- 2021 Fears Rd
- 17.383 Ac Fears Rd
- 3001 Davis Academy Rd
- 1751 Fears Rd
- 2061 Fears Rd
- 2821 Davis Academy Rd
- 0 287 Acres Fears Rd
- 3061 Davis Academy Rd
- 0 Fears Rd
- 0 Fears Rd Unit CM955053
- 0 Fears Rd Unit CM972555
- 0 Fears Rd Unit 20010914
- 0 Fears Rd Unit 7577069
- 0 Fears Rd Unit 8145794
- 0 Fears Rd Unit 8702183
- 3121 Davis Academy Rd
Your Personal Tour Guide
Ask me questions while you tour the home.