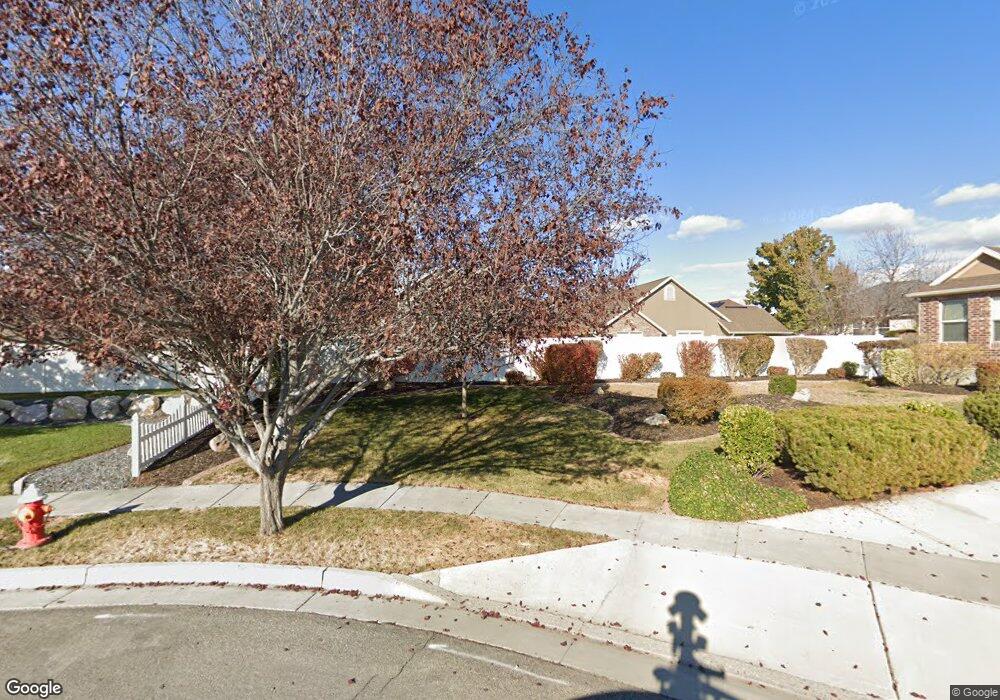
1941 S 830 W Unit B Syracuse, UT 84075
Estimated Value: $485,000 - $503,940
2
Beds
2
Baths
1,770
Sq Ft
$280/Sq Ft
Est. Value
About This Home
This home is located at 1941 S 830 W Unit B, Syracuse, UT 84075 and is currently estimated at $496,485, approximately $280 per square foot. 1941 S 830 W Unit B is a home located in Davis County with nearby schools including Bluff Ridge Elementary, Legacy Junior High School, and Clearfield High School.
Ownership History
Date
Name
Owned For
Owner Type
Purchase Details
Closed on
Aug 30, 2023
Sold by
Clyde And Edna Cotner Family Trust
Bought by
Cassity James and Cassity Sherri
Current Estimated Value
Home Financials for this Owner
Home Financials are based on the most recent Mortgage that was taken out on this home.
Original Mortgage
$340,000
Outstanding Balance
$332,209
Interest Rate
6.78%
Mortgage Type
New Conventional
Estimated Equity
$164,276
Purchase Details
Closed on
Mar 12, 2018
Sold by
Cotner Clyde W and Cotner Edna J
Bought by
Clyde W Cotner and Cotner Family Trust
Purchase Details
Closed on
Jan 7, 2013
Sold by
Leisure Villas Inc
Bought by
Cotner Clyde W and Cotner Edna J
Home Financials for this Owner
Home Financials are based on the most recent Mortgage that was taken out on this home.
Original Mortgage
$139,900
Interest Rate
3.27%
Mortgage Type
New Conventional
Create a Home Valuation Report for This Property
The Home Valuation Report is an in-depth analysis detailing your home's value as well as a comparison with similar homes in the area
Home Values in the Area
Average Home Value in this Area
Purchase History
| Date | Buyer | Sale Price | Title Company |
|---|---|---|---|
| Cassity James | -- | Us Title Insurance Agency | |
| Clyde W Cotner | -- | -- | |
| Cotner Clyde W | -- | -- | |
| Cotner Clyde W | -- | Metro National Title |
Source: Public Records
Mortgage History
| Date | Status | Borrower | Loan Amount |
|---|---|---|---|
| Open | Cassity James | $340,000 | |
| Previous Owner | Cotner Clyde W | $139,900 |
Source: Public Records
Tax History Compared to Growth
Tax History
| Year | Tax Paid | Tax Assessment Tax Assessment Total Assessment is a certain percentage of the fair market value that is determined by local assessors to be the total taxable value of land and additions on the property. | Land | Improvement |
|---|---|---|---|---|
| 2025 | $2,605 | $251,350 | $76,450 | $174,900 |
| 2024 | $2,542 | $246,950 | $60,500 | $186,450 |
| 2023 | $2,492 | $441,000 | $113,000 | $328,000 |
| 2022 | $2,551 | $247,500 | $52,800 | $194,700 |
| 2021 | $2,450 | $368,000 | $79,000 | $289,000 |
| 2020 | $2,338 | $340,000 | $74,700 | $265,300 |
| 2019 | $2,201 | $316,000 | $75,000 | $241,000 |
| 2018 | $2,063 | $294,000 | $85,000 | $209,000 |
| 2016 | $1,897 | $141,790 | $33,000 | $108,790 |
| 2015 | $1,873 | $133,265 | $33,000 | $100,265 |
| 2014 | $1,854 | $134,436 | $18,333 | $116,103 |
| 2013 | -- | $130,713 | $21,175 | $109,538 |
Source: Public Records
Map
Nearby Homes
- 1941 S 830 W Unit A
- 1941 S 830 W Unit C
- 837 W 1920 S Unit A
- 1982 S 800 W
- 1981 S 800 W
- 1919 S 830 W Unit D
- 1919 S 830 W Unit D
- 1946 Bluff Ridge Dr
- 1994 S 800 W
- 1993 S 800 W
- 1930 Bluff Ridge Dr
- 1983 S 850 W
- 853 W 1920 S Unit C
- 853 W 1920 S Unit A
- 853 W 1920 S Unit B
- 1962 Bluff Ridge Dr
- 1914 Bluff Ridge Dr
- 1897 S 830 W Unit D
- 762 W 2010 S
- 1995 S 850 W