Estimated Value: $649,358 - $708,000
6
Beds
4
Baths
2,501
Sq Ft
$273/Sq Ft
Est. Value
About This Home
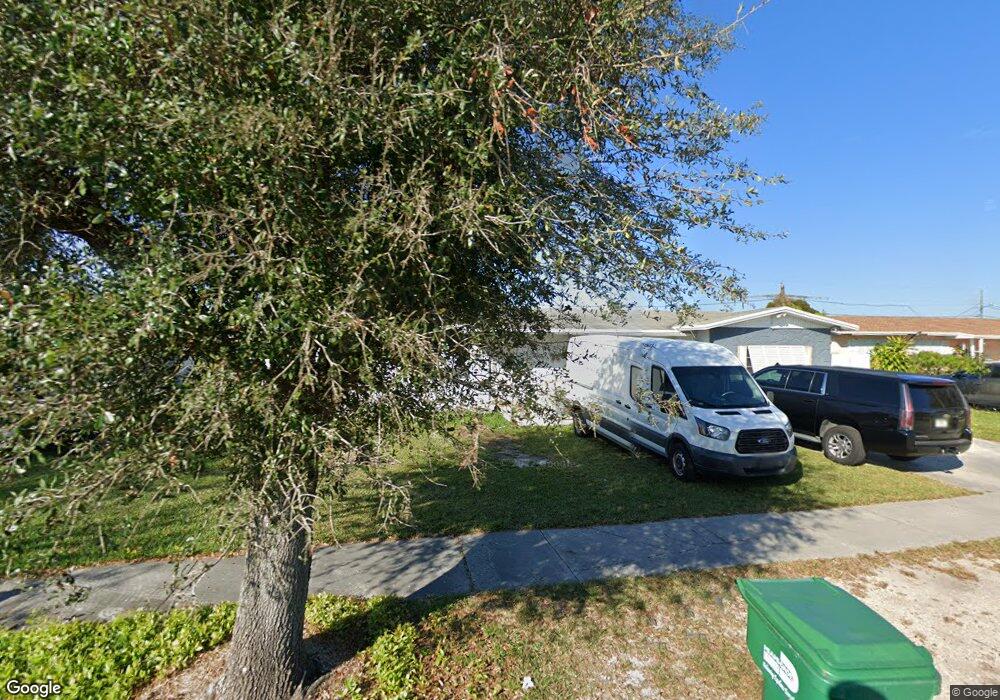
This home is located at 19410 SW 117th Ave, Miami, FL 33177 and is currently estimated at $683,090, approximately $273 per square foot. 19410 SW 117th Ave is a home located in Miami-Dade County with nearby schools including Caribbean K-8 Center, Miami Southridge Senior High School, and Arthur And Polly Mays Conservatory Of The Arts.
Ownership History
Date
Name
Owned For
Owner Type
Purchase Details
Closed on
Aug 24, 2011
Sold by
Valman Trading Corp
Bought by
Manresa Raul L Valdes and Chapotin Clara M
Current Estimated Value
Purchase Details
Closed on
Jan 10, 2011
Sold by
Bank Of America National Association
Bought by
Valman Trading Corp
Purchase Details
Closed on
Jun 28, 2010
Sold by
Acosta Osvaldo
Bought by
Bank Of America National Association
Purchase Details
Closed on
Oct 5, 2006
Sold by
Canada Joseph P
Bought by
Acosta Osvaldo
Home Financials for this Owner
Home Financials are based on the most recent Mortgage that was taken out on this home.
Original Mortgage
$281,600
Interest Rate
7.65%
Mortgage Type
Stand Alone First
Purchase Details
Closed on
Mar 11, 2004
Sold by
Canada Joseph Persell and Canada Leola M
Bought by
Canada Joseph P
Create a Home Valuation Report for This Property
The Home Valuation Report is an in-depth analysis detailing your home's value as well as a comparison with similar homes in the area
Home Values in the Area
Average Home Value in this Area
Purchase History
| Date | Buyer | Sale Price | Title Company |
|---|---|---|---|
| Manresa Raul L Valdes | $64,300 | Union Title Services Inc | |
| Valman Trading Corp | $70,000 | Consumer Title & Escrow Serv | |
| Bank Of America National Association | $32,100 | None Available | |
| Acosta Osvaldo | $352,000 | Attorney | |
| Canada Joseph P | -- | -- |
Source: Public Records
Mortgage History
| Date | Status | Borrower | Loan Amount |
|---|---|---|---|
| Previous Owner | Acosta Osvaldo | $281,600 |
Source: Public Records
Tax History Compared to Growth
Tax History
| Year | Tax Paid | Tax Assessment Tax Assessment Total Assessment is a certain percentage of the fair market value that is determined by local assessors to be the total taxable value of land and additions on the property. | Land | Improvement |
|---|---|---|---|---|
| 2025 | $2,864 | $170,357 | -- | -- |
| 2024 | $2,647 | $165,556 | -- | -- |
| 2023 | $2,647 | $160,734 | $0 | $0 |
| 2022 | $2,525 | $156,053 | $0 | $0 |
| 2021 | $2,490 | $151,508 | $0 | $0 |
| 2020 | $2,462 | $149,417 | $0 | $0 |
| 2019 | $2,404 | $146,058 | $0 | $0 |
| 2018 | $2,284 | $143,335 | $0 | $0 |
| 2017 | $2,266 | $140,387 | $0 | $0 |
| 2016 | $2,229 | $137,500 | $0 | $0 |
| 2015 | $2,246 | $136,545 | $0 | $0 |
| 2014 | $2,274 | $135,462 | $0 | $0 |
Source: Public Records
Map
Nearby Homes
- 19360 SW 116th Ave
- 19610 SW 117th Ave
- 19513 SW 116th Ave
- 19251 SW 118th Ct
- 11460 SW 196th Terrace
- 11431 SW 193rd Terrace
- 11872 SW 196th Terrace
- 11520 SW 191st St
- 19220 SW 119th Place
- 19715 SW 114th Ave Unit 357
- 19715 SW 114th Ave Unit 35612
- 19781 SW 114th Ave Unit 143
- 19491 SW 121st Ave
- 11470 SW 199th St
- 19729 SW 114th Ave Unit 250
- 12001 SW 191st Terrace
- 19316 SW 121st Ave
- 11950 SW 199th St
- 11875 SW 189th St
- 20000 SW 114th Ave
- 19420 SW 117th Ave
- 19400 SW 117th Ave
- 19415 SW 117th Ct
- 19425 SW 117th Ct
- 19405 SW 117th Ct
- 19430 SW 117th Ave
- 19350 SW 117th Ave
- 19435 SW 117th Ct
- 19345 SW 117th Ct
- 19500 SW 117th Ave
- 19335 SW 117th Ct
- 19420 SW 117th Ct
- 19430 SW 117th Ct
- 19410 SW 117th Ct
- 19510 SW 117th Ave
- 19401 SW 117th Ave
- 19515 SW 117th Ct
- 19421 SW 117th Ave
- 19411 SW 117th Ave
- 19371 SW 117th Ave