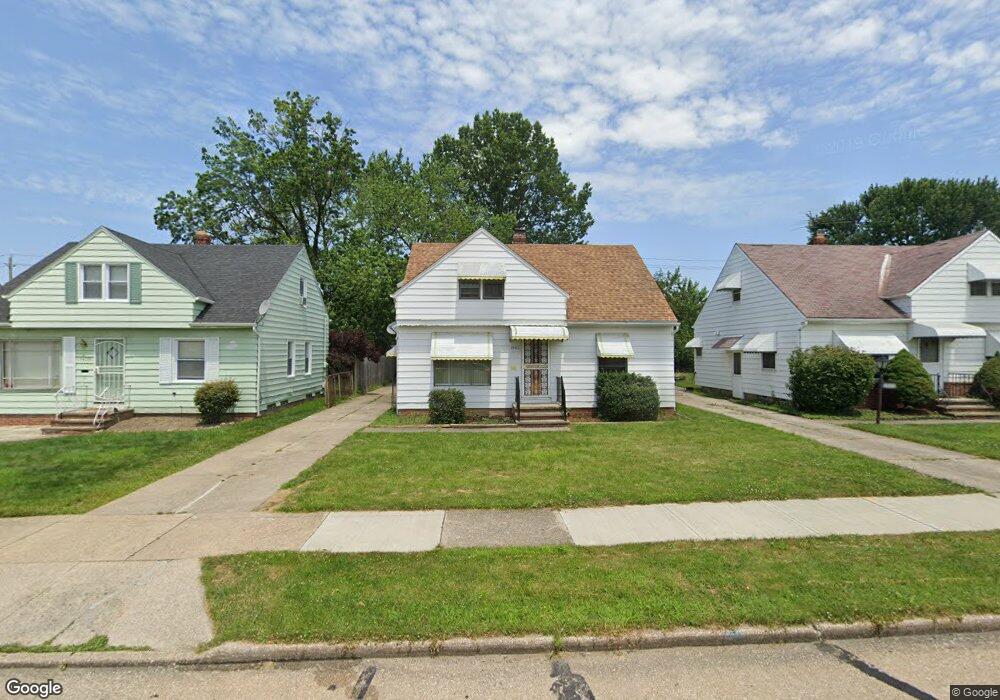
19413 Longview Ave Maple Heights, OH 44137
Estimated Value: $122,000 - $140,000
3
Beds
1
Bath
1,198
Sq Ft
$110/Sq Ft
Est. Value
About This Home
This home is located at 19413 Longview Ave, Maple Heights, OH 44137 and is currently estimated at $131,667, approximately $109 per square foot. 19413 Longview Ave is a home located in Cuyahoga County with nearby schools including Abraham Lincoln Elementary School, Rockside/ J.F. Kennedy School, and Barack Obama School.
Ownership History
Date
Name
Owned For
Owner Type
Purchase Details
Closed on
Mar 10, 2021
Sold by
Cuyahoga Development Group
Bought by
L & L Flynn Properties Llc
Current Estimated Value
Home Financials for this Owner
Home Financials are based on the most recent Mortgage that was taken out on this home.
Original Mortgage
$1,102,020
Interest Rate
3.69%
Mortgage Type
New Conventional
Purchase Details
Closed on
Oct 23, 2017
Sold by
Alonzo Cady and Us Bank National Association
Bought by
Cuyahoga Development Group
Purchase Details
Closed on
Aug 18, 1997
Sold by
Roth Anthony J
Bought by
Cady Betty J
Home Financials for this Owner
Home Financials are based on the most recent Mortgage that was taken out on this home.
Original Mortgage
$79,959
Interest Rate
7.71%
Mortgage Type
New Conventional
Purchase Details
Closed on
Jan 1, 1975
Bought by
Roth Anthony J and Roth Jacqueline
Create a Home Valuation Report for This Property
The Home Valuation Report is an in-depth analysis detailing your home's value as well as a comparison with similar homes in the area
Home Values in the Area
Average Home Value in this Area
Purchase History
| Date | Buyer | Sale Price | Title Company |
|---|---|---|---|
| L & L Flynn Properties Llc | $1,515,890 | Chicago Title | |
| Cuyahoga Development Group | $17,580 | None Available | |
| Cady Betty J | $80,000 | -- | |
| Roth Anthony J | -- | -- |
Source: Public Records
Mortgage History
| Date | Status | Borrower | Loan Amount |
|---|---|---|---|
| Previous Owner | L & L Flynn Properties Llc | $1,102,020 | |
| Previous Owner | Cady Betty J | $79,959 |
Source: Public Records
Tax History
| Year | Tax Paid | Tax Assessment Tax Assessment Total Assessment is a certain percentage of the fair market value that is determined by local assessors to be the total taxable value of land and additions on the property. | Land | Improvement |
|---|---|---|---|---|
| 2024 | $2,853 | $30,100 | $7,140 | $22,960 |
| 2023 | $2,257 | $20,240 | $4,310 | $15,930 |
| 2022 | $2,249 | $20,230 | $4,305 | $15,925 |
| 2021 | $2,396 | $20,230 | $4,310 | $15,930 |
| 2020 | $2,053 | $15,330 | $3,260 | $12,080 |
| 2019 | $1,928 | $43,800 | $9,300 | $34,500 |
| 2018 | $1,910 | $15,330 | $3,260 | $12,080 |
| 2017 | $2,390 | $14,140 | $3,010 | $11,130 |
| 2016 | $1,871 | $14,140 | $3,010 | $11,130 |
| 2015 | $1,777 | $14,140 | $3,010 | $11,130 |
| 2014 | $1,777 | $15,550 | $3,330 | $12,220 |
Source: Public Records
Map
Nearby Homes
- 19931 Raymond St
- 5165 Camden Rd
- 18990 Raymond St
- 18851 Raymond St
- 19520 Maple Heights Blvd
- 5194 Homewood Ave
- 18704 Longview Ave
- 5147 Warrensville Center Rd
- 20600 Watson Rd
- 20517 Raymond St
- 20705 Hansen Rd
- 20715 Watson Rd
- 18715 Libby Rd
- 5100 Erwin St
- 19289 Stafford Ave
- 20806 Clare Ave
- 20905 Clare Ave
- 18909 Maple Heights Blvd
- 5219 Joseph St
- 5150 Arch St
- 19417 Longview Ave
- 19409 Longview Ave
- 19501 Longview Ave
- 19405 Longview Ave
- 19500 Fairway Ave
- 19416 Fairway Ave
- 19504 Fairway Ave
- 19505 Longview Ave
- 19401 Longview Ave
- 19412 Fairway Ave
- 19508 Fairway Ave
- 19412 Longview Ave
- 19408 Fairway Ave
- 19416 Longview Ave
- 19408 Longview Ave
- 19512 Fairway Ave
- 19509 Longview Ave
- 19317 Longview Ave
- 19500 Longview Ave
- 19404 Fairway Ave
Your Personal Tour Guide
Ask me questions while you tour the home.