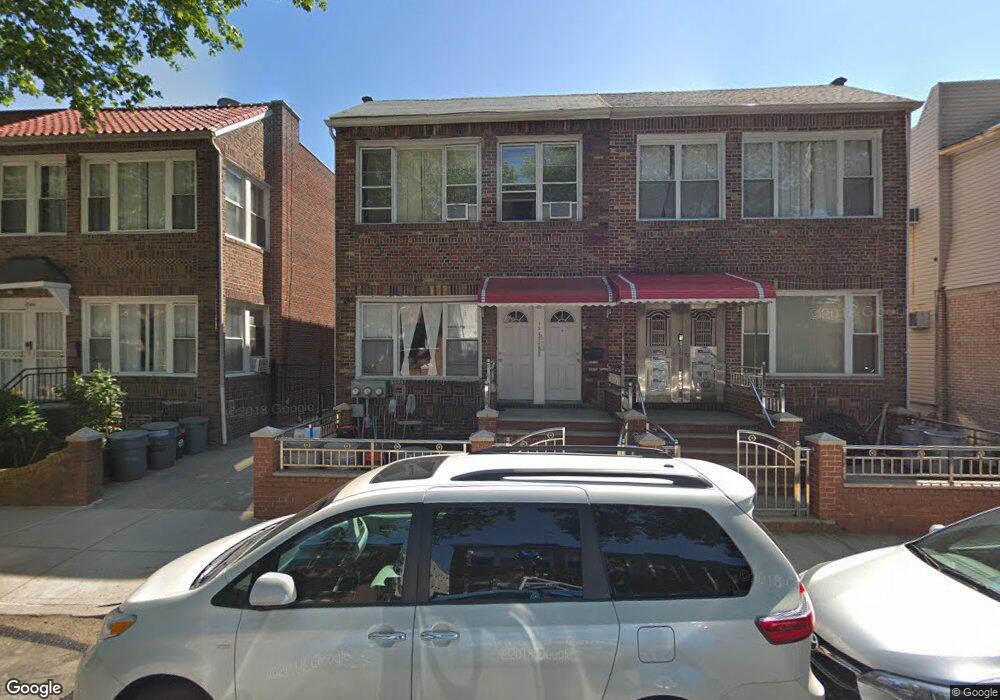
1942 73rd St Brooklyn, NY 11204
Bensonhurst NeighborhoodEstimated Value: $1,340,251 - $1,646,000
--
Bed
--
Bath
2,352
Sq Ft
$649/Sq Ft
Est. Value
About This Home
This home is located at 1942 73rd St, Brooklyn, NY 11204 and is currently estimated at $1,525,813, approximately $648 per square foot. 1942 73rd St is a home located in Kings County with nearby schools including P.S. 186 Dr. Irving A. Gladstone Elementary School, Seth Low Intermediate School 96, and New Utrecht High School.
Ownership History
Date
Name
Owned For
Owner Type
Purchase Details
Closed on
Jul 12, 2010
Sold by
Chen Florence Y and Chu Fred
Bought by
Wong Ngai Chun and Wu Bai Yu
Current Estimated Value
Home Financials for this Owner
Home Financials are based on the most recent Mortgage that was taken out on this home.
Original Mortgage
$480,000
Outstanding Balance
$318,364
Interest Rate
4.76%
Mortgage Type
Purchase Money Mortgage
Estimated Equity
$1,207,449
Purchase Details
Closed on
Jan 31, 2007
Sold by
Chan Koon Fat and Chan Koon Kiu
Bought by
Chen Florence Y and Chu Fred
Home Financials for this Owner
Home Financials are based on the most recent Mortgage that was taken out on this home.
Original Mortgage
$496,000
Interest Rate
6.24%
Mortgage Type
Purchase Money Mortgage
Create a Home Valuation Report for This Property
The Home Valuation Report is an in-depth analysis detailing your home's value as well as a comparison with similar homes in the area
Home Values in the Area
Average Home Value in this Area
Purchase History
| Date | Buyer | Sale Price | Title Company |
|---|---|---|---|
| Wong Ngai Chun | $680,000 | -- | |
| Wong Ngai Chun | $680,000 | -- | |
| Chen Florence Y | $620,000 | -- | |
| Chen Florence Y | $620,000 | -- |
Source: Public Records
Mortgage History
| Date | Status | Borrower | Loan Amount |
|---|---|---|---|
| Open | Wong Ngai Chun | $480,000 | |
| Closed | Wong Ngai Chun | $480,000 | |
| Previous Owner | Chen Florence Y | $496,000 |
Source: Public Records
Tax History Compared to Growth
Tax History
| Year | Tax Paid | Tax Assessment Tax Assessment Total Assessment is a certain percentage of the fair market value that is determined by local assessors to be the total taxable value of land and additions on the property. | Land | Improvement |
|---|---|---|---|---|
| 2025 | $8,527 | $81,840 | $12,720 | $69,120 |
| 2024 | $8,527 | $87,660 | $12,720 | $74,940 |
| 2023 | $8,186 | $84,360 | $12,720 | $71,640 |
| 2022 | $7,191 | $87,060 | $12,720 | $74,340 |
| 2021 | $7,981 | $81,120 | $12,720 | $68,400 |
| 2020 | $5,926 | $79,860 | $12,720 | $67,140 |
| 2019 | $5,895 | $79,860 | $12,720 | $67,140 |
| 2018 | $6,787 | $34,754 | $6,069 | $28,685 |
| 2017 | $6,420 | $32,962 | $6,146 | $26,816 |
| 2016 | $6,280 | $32,962 | $7,371 | $25,591 |
| 2015 | $3,531 | $32,271 | $10,803 | $21,468 |
| 2014 | $3,531 | $30,456 | $11,415 | $19,041 |
Source: Public Records
Map
Nearby Homes