Estimated Value: $957,000 - $1,312,000
3
Beds
3
Baths
3,807
Sq Ft
$295/Sq Ft
Est. Value
About This Home
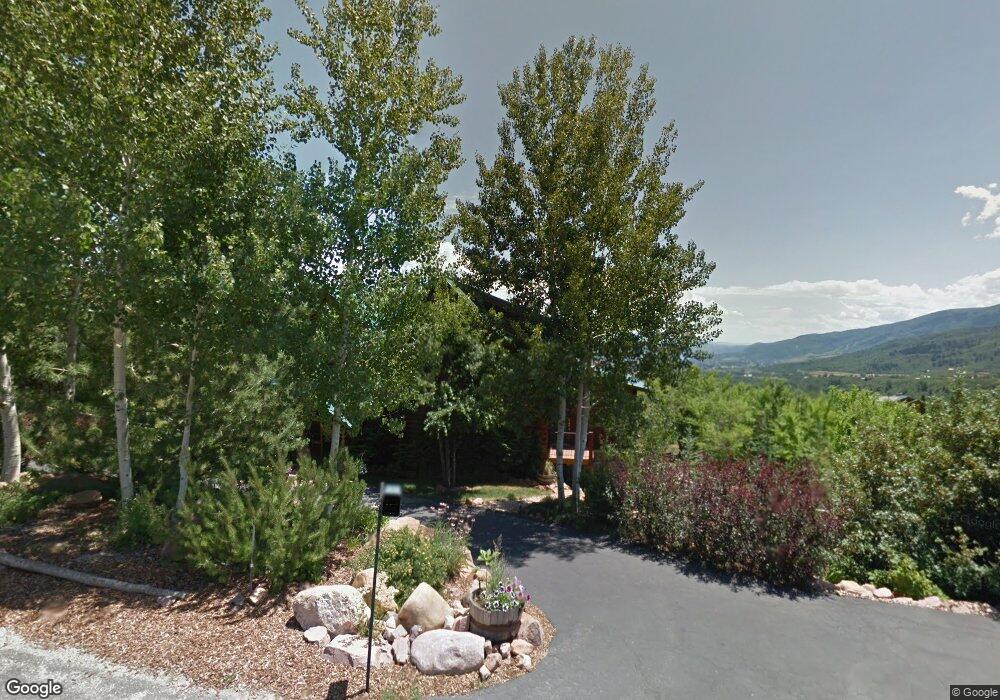
This home is located at 1942 E 6925 N, Eden, UT 84310 and is currently estimated at $1,122,049, approximately $294 per square foot. 1942 E 6925 N is a home located in Weber County with nearby schools including Valley Elementary School, Snowcrest Junior High School, and Weber High School.
Ownership History
Date
Name
Owned For
Owner Type
Purchase Details
Closed on
Mar 23, 2023
Sold by
Deutschlander Kenneth R
Bought by
Kdns Living Trust
Current Estimated Value
Purchase Details
Closed on
Apr 15, 2014
Sold by
King Robert E and King Robin M
Bought by
Deutschlander Kenneth and Scarlett Nora
Purchase Details
Closed on
Nov 12, 2010
Sold by
King Robert and King Robin
Bought by
King Robert E and King Robin M
Home Financials for this Owner
Home Financials are based on the most recent Mortgage that was taken out on this home.
Original Mortgage
$217,102
Interest Rate
3.12%
Mortgage Type
Adjustable Rate Mortgage/ARM
Purchase Details
Closed on
May 20, 2009
Sold by
King Robert and King Robin
Bought by
King Robert and King Robin
Purchase Details
Closed on
Sep 20, 1996
Sold by
Boggess Bret L and Boggess Myrna
Bought by
King Robert and King Robin
Purchase Details
Closed on
Mar 18, 1996
Sold by
Klev Kurt
Bought by
Boggess Bret L and Boggess Myrna
Create a Home Valuation Report for This Property
The Home Valuation Report is an in-depth analysis detailing your home's value as well as a comparison with similar homes in the area
Purchase History
| Date | Buyer | Sale Price | Title Company |
|---|---|---|---|
| Kdns Living Trust | -- | None Listed On Document | |
| Deutschlander Kenneth | -- | Metro National Title | |
| King Robert E | -- | Metro National Title | |
| King Robert | -- | None Available | |
| King Robert | -- | Mountain View Title | |
| Boggess Bret L | -- | Us Title | |
| Klev Kurt | -- | Us Title |
Source: Public Records
Mortgage History
| Date | Status | Borrower | Loan Amount |
|---|---|---|---|
| Previous Owner | King Robert E | $217,102 |
Source: Public Records
Tax History
| Year | Tax Paid | Tax Assessment Tax Assessment Total Assessment is a certain percentage of the fair market value that is determined by local assessors to be the total taxable value of land and additions on the property. | Land | Improvement |
|---|---|---|---|---|
| 2025 | $5,235 | $974,758 | $239,677 | $735,081 |
| 2024 | $4,817 | $914,000 | $239,614 | $674,386 |
| 2023 | $4,800 | $900,164 | $228,139 | $672,025 |
| 2022 | $4,223 | $805,413 | $208,101 | $597,312 |
| 2021 | $3,894 | $689,000 | $136,768 | $552,232 |
| 2020 | $3,965 | $644,000 | $136,768 | $507,232 |
| 2019 | $4,060 | $631,258 | $136,768 | $494,490 |
| 2018 | $3,804 | $568,760 | $129,066 | $439,694 |
| 2017 | $3,427 | $498,584 | $119,050 | $379,534 |
| 2016 | $3,402 | $270,475 | $64,550 | $205,925 |
| 2015 | $3,028 | $238,028 | $64,550 | $173,478 |
| 2014 | $3,069 | $256,836 | $64,550 | $192,286 |
Source: Public Records
Map
Nearby Homes
- 6679 N Durfee Creek Rd
- 6481 N Fork Rd Unit N
- 6124 N 2250 E
- 3178 E 5400 N
- 4691 N 3300 E
- 4691 E 3300
- 4622 N 3150 E
- 4548 N Sheep Creek Dr
- 4601 N 2900 E
- 3462 E 4100 N
- 4068 N 3300 E
- 3440 E 4100 N
- 2808 E Arrowleaf Unit 2
- 1382 N 6300 E Unit 3
- 4937 E Fairways Dr N
- 8526 E Overlook Dr
- 5013 E Maple Oak E Unit 28
- 6741 E Aspen Dr N
- 1940 N Shamy Way Unit 27
- 6825 E 6675 N Unit 52
- 6975 N Durfee Way Unit 20
- 1984 E 6925 N
- 6989 N Durfee Way Unit 21
- 6962 Durfee Way
- 6961 N Durfee Way
- 6975 Durfee Way
- 6975 Durfee Way Unit 20
- 1941 E 6925 N
- 1941 E 6925 N Unit 15
- 6961 Durfee Way
- 6989 Durfee Way
- 1983 E 6925 N
- 6992 Durfee Way
- 6992 N Durfee Way
- 1919 E 6925 N
- 1919 E 6925 N Unit 16
- 1963 E 6925 N
- 1963 E 6925 N Unit 14
- 6999 Durfee Way
- 1892 E 6925 N