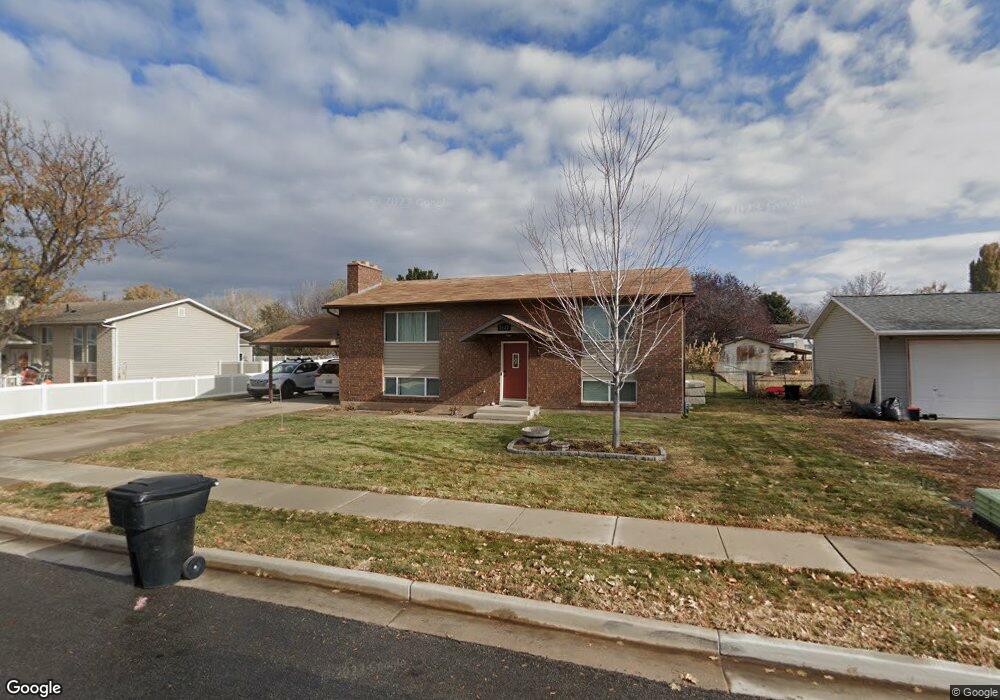
1942 N 1225 W Clearfield, UT 84015
Estimated Value: $417,000 - $440,000
4
Beds
2
Baths
2,016
Sq Ft
$212/Sq Ft
Est. Value
About This Home
This home is located at 1942 N 1225 W, Clearfield, UT 84015 and is currently estimated at $427,679, approximately $212 per square foot. 1942 N 1225 W is a home located in Davis County with nearby schools including Clinton Elementary School, Sunset Junior High School, and Clearfield High School.
Ownership History
Date
Name
Owned For
Owner Type
Purchase Details
Closed on
Jun 13, 2016
Sold by
Soorma Kapil
Bought by
Newman Jacob Randy and Newman Anna Henry
Current Estimated Value
Purchase Details
Closed on
Mar 15, 2007
Sold by
Allen Ryan W and Allen Penny K
Bought by
Soorma Kapil
Home Financials for this Owner
Home Financials are based on the most recent Mortgage that was taken out on this home.
Original Mortgage
$138,600
Interest Rate
6.29%
Mortgage Type
Purchase Money Mortgage
Purchase Details
Closed on
Sep 1, 2005
Sold by
Benson Sandra Y
Bought by
Allen Ryan W and Allen Penny K
Home Financials for this Owner
Home Financials are based on the most recent Mortgage that was taken out on this home.
Original Mortgage
$17,330
Interest Rate
5.22%
Mortgage Type
Stand Alone Second
Purchase Details
Closed on
Sep 30, 2004
Sold by
Benson Sandra Yvonne and Benson Sandra Y
Bought by
Benson Sandra Y
Purchase Details
Closed on
Sep 8, 2004
Sold by
Benson Robert Scott
Bought by
Benson Sandra Yvonne
Create a Home Valuation Report for This Property
The Home Valuation Report is an in-depth analysis detailing your home's value as well as a comparison with similar homes in the area
Home Values in the Area
Average Home Value in this Area
Purchase History
| Date | Buyer | Sale Price | Title Company |
|---|---|---|---|
| Newman Jacob Randy | -- | Us Title | |
| Soorma Kapil | -- | Equity Title Ins Agency Inc | |
| Allen Ryan W | -- | Bonneville Title Company | |
| Benson Sandra Y | -- | -- | |
| Benson Sandra Yvonne | -- | -- |
Source: Public Records
Mortgage History
| Date | Status | Borrower | Loan Amount |
|---|---|---|---|
| Previous Owner | Soorma Kapil | $138,600 | |
| Previous Owner | Allen Ryan W | $17,330 | |
| Previous Owner | Allen Ryan W | $92,300 |
Source: Public Records
Tax History Compared to Growth
Tax History
| Year | Tax Paid | Tax Assessment Tax Assessment Total Assessment is a certain percentage of the fair market value that is determined by local assessors to be the total taxable value of land and additions on the property. | Land | Improvement |
|---|---|---|---|---|
| 2025 | $2,128 | $204,600 | $93,812 | $110,788 |
| 2024 | $2,083 | $201,300 | $102,757 | $98,543 |
| 2023 | $1,912 | $342,000 | $117,547 | $224,453 |
| 2022 | $2,029 | $200,750 | $71,130 | $129,620 |
| 2021 | $1,867 | $274,000 | $90,356 | $183,644 |
| 2020 | $1,611 | $234,000 | $77,478 | $156,522 |
| 2019 | $1,564 | $222,000 | $89,243 | $132,757 |
| 2018 | $1,384 | $193,000 | $75,210 | $117,790 |
| 2016 | $1,199 | $86,295 | $29,433 | $56,862 |
| 2015 | $1,129 | $77,275 | $29,433 | $47,842 |
| 2014 | $1,047 | $72,796 | $29,433 | $43,363 |
| 2013 | -- | $74,795 | $25,230 | $49,565 |
Source: Public Records
Map
Nearby Homes