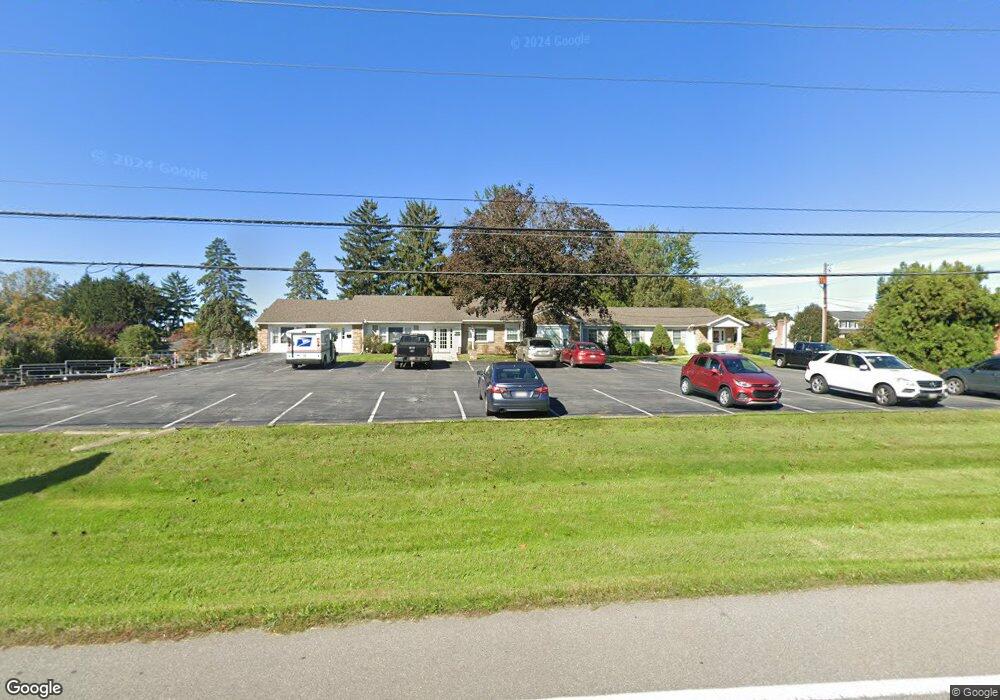
19426 Leitersburg Pike Hagerstown, MD 21742
Estimated Value: $1,190,285
--
Bed
--
Bath
5,382
Sq Ft
$221/Sq Ft
Est. Value
About This Home
This home is located at 19426 Leitersburg Pike, Hagerstown, MD 21742 and is currently estimated at $1,190,285, approximately $221 per square foot. 19426 Leitersburg Pike is a home located in Washington County with nearby schools including Paramount Elementary School, Otsego West Campus High School, and Northern Middle School.
Ownership History
Date
Name
Owned For
Owner Type
Purchase Details
Closed on
Jul 16, 2021
Sold by
Martin Delvern L and Martin Doris M
Bought by
Dhingi Llc
Current Estimated Value
Purchase Details
Closed on
Jul 13, 2016
Sold by
Earley Drive Llc and Dickinson B Mark
Bought by
Martin Delvern L and Martin Doris M
Home Financials for this Owner
Home Financials are based on the most recent Mortgage that was taken out on this home.
Original Mortgage
$676,000
Interest Rate
3.54%
Mortgage Type
Purchase Money Mortgage
Purchase Details
Closed on
Aug 5, 2003
Sold by
Dickinson B Mark Et Al Trustees
Bought by
Earley Drive Llc
Purchase Details
Closed on
Jan 9, 1998
Sold by
Dickinson Breese M and Dickinson Ann K
Bought by
Dickinson B Mark Et Al Trustees
Create a Home Valuation Report for This Property
The Home Valuation Report is an in-depth analysis detailing your home's value as well as a comparison with similar homes in the area
Home Values in the Area
Average Home Value in this Area
Purchase History
| Date | Buyer | Sale Price | Title Company |
|---|---|---|---|
| Dhingi Llc | $950,000 | Premier Stlmts & Ttl Svcs Ll | |
| Martin Delvern L | $845,000 | None Available | |
| Earley Drive Llc | $145,826 | -- | |
| Dickinson B Mark Et Al Trustees | -- | -- |
Source: Public Records
Mortgage History
| Date | Status | Borrower | Loan Amount |
|---|---|---|---|
| Previous Owner | Martin Delvern L | $676,000 |
Source: Public Records
Tax History Compared to Growth
Tax History
| Year | Tax Paid | Tax Assessment Tax Assessment Total Assessment is a certain percentage of the fair market value that is determined by local assessors to be the total taxable value of land and additions on the property. | Land | Improvement |
|---|---|---|---|---|
| 2025 | $6,590 | $651,100 | $0 | $0 |
| 2024 | $6,590 | $636,500 | $516,000 | $120,500 |
| 2023 | $6,590 | $636,500 | $516,000 | $120,500 |
| 2022 | $6,590 | $636,500 | $516,000 | $120,500 |
| 2021 | $8,554 | $810,600 | $516,000 | $294,600 |
| 2020 | $7,052 | $737,933 | $0 | $0 |
| 2019 | $7,052 | $665,267 | $0 | $0 |
| 2018 | $6,979 | $592,600 | $516,000 | $76,600 |
| 2017 | $5,925 | $575,800 | $0 | $0 |
| 2016 | -- | $559,000 | $0 | $0 |
| 2015 | -- | $542,200 | $0 | $0 |
| 2014 | $5,307 | $533,233 | $0 | $0 |
Source: Public Records
Map
Nearby Homes
- 12930 Oak Hill Ave
- 13105 Little Hayden Cir Unit AREA BLOCK ELEVEN
- 13001 Little Hayden Cir Unit 42
- 12993 Little Hayden Cir
- 12933 Little Hayden Cir
- 12926 Hawkins Cir Unit 26
- 12928 Hawkins Cir
- 13116 Blue Ridge Rd
- 13101 Fountain Head Rd
- 13028 Woodburn Dr
- 12819 Fountain Head Rd
- 13110 Woodburn Dr
- 13350 Diamond Pointe Dr Unit V227
- 19446 Sapphire Dr
- 0 Diamond Pointe Dr Unit V120
- 19703 Portsmouth Dr
- 19702 Portsmouth Dr
- 108 Linden Ave
- 670 Northern Ave
- 1302 Oak Hill Ave
- 19426 Leitersburg Pike Unit SUITE 101
- Parcel 431 Leitersburg Pike
- 19418 Leitersburg Pike
- 0 Leitersburg Pike
- 12918 Oak Hill Ave
- 12922 Oak Hill Ave
- 12931 Oak Hill Ave
- 12914 Oak Hill Ave
- 12926 Oak Hill Ave
- 19414 Leitersburg Pike
- 19414 Leitersburg Pike Unit SUITE A
- 12916 Conamar Dr
- 12916 Conamar Dr Unit 105
- 12910 Oak Hill Ave
- 12915 The Terrace
- 12911 The Terrace
- 12919 The Terrace
- 19436 Leitersburg Pike
- 12920 Conamar Dr
- 12906 Oak Hill Ave