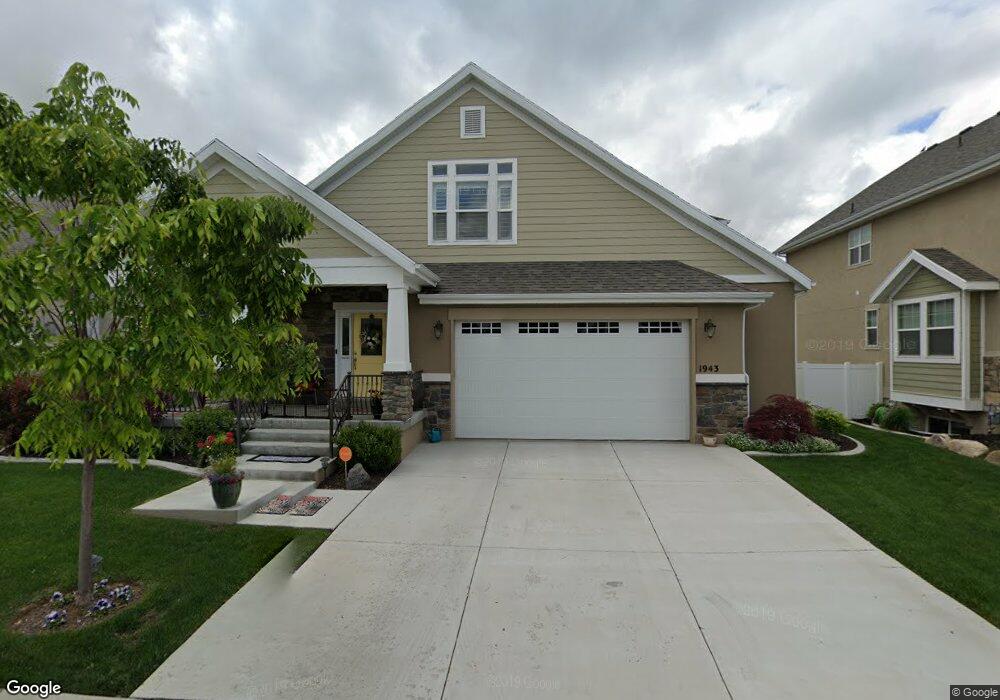
1943 W Yarrow Dr Unit L03 Mapleton, UT 84664
Estimated Value: $742,000 - $934,000
5
Beds
3
Baths
5,291
Sq Ft
$159/Sq Ft
Est. Value
About This Home
This home is located at 1943 W Yarrow Dr Unit L03, Mapleton, UT 84664 and is currently estimated at $843,440, approximately $159 per square foot. 1943 W Yarrow Dr Unit L03 is a home located in Utah County with nearby schools including Maple Ridge Elementary, Mapleton Junior High School, and Maple Mountain High School.
Ownership History
Date
Name
Owned For
Owner Type
Purchase Details
Closed on
Nov 7, 2019
Sold by
Wilkinson Cecelia Marie and Wilkinson Cecelia Marie
Bought by
Folster Scott and Folster Analee
Current Estimated Value
Home Financials for this Owner
Home Financials are based on the most recent Mortgage that was taken out on this home.
Original Mortgage
$155,000
Outstanding Balance
$136,360
Interest Rate
3.6%
Mortgage Type
New Conventional
Estimated Equity
$707,080
Purchase Details
Closed on
Apr 29, 2015
Sold by
Earl Adam T
Bought by
Wilkinson Cecelia Marie
Purchase Details
Closed on
Sep 10, 2014
Sold by
Summit Construction Services Llc
Bought by
Earl Adam T
Home Financials for this Owner
Home Financials are based on the most recent Mortgage that was taken out on this home.
Original Mortgage
$325,216
Interest Rate
4.09%
Mortgage Type
Construction
Purchase Details
Closed on
Oct 7, 2013
Sold by
Rees Enterprises Ltd
Bought by
Summit Construction Services Llc
Purchase Details
Closed on
Sep 30, 2013
Sold by
Wp Development Llc
Bought by
Rees Enterprises Ltd
Purchase Details
Closed on
Sep 15, 2005
Sold by
Jb3 Llc
Bought by
Wp Development Llc
Create a Home Valuation Report for This Property
The Home Valuation Report is an in-depth analysis detailing your home's value as well as a comparison with similar homes in the area
Home Values in the Area
Average Home Value in this Area
Purchase History
| Date | Buyer | Sale Price | Title Company |
|---|---|---|---|
| Folster Scott | -- | Stewart Title Ins Agcy Of Ut | |
| Wilkinson Cecelia Marie | -- | Inwest Title | |
| Earl Adam T | -- | Keystone Title Ins Agen | |
| Summit Construction Services Llc | -- | None Available | |
| Rees Enterprises Ltd | -- | None Available | |
| Wp Development Llc | -- | -- |
Source: Public Records
Mortgage History
| Date | Status | Borrower | Loan Amount |
|---|---|---|---|
| Open | Folster Scott | $155,000 | |
| Previous Owner | Earl Adam T | $325,216 |
Source: Public Records
Tax History Compared to Growth
Tax History
| Year | Tax Paid | Tax Assessment Tax Assessment Total Assessment is a certain percentage of the fair market value that is determined by local assessors to be the total taxable value of land and additions on the property. | Land | Improvement |
|---|---|---|---|---|
| 2025 | $3,828 | $403,040 | $176,300 | $556,500 |
| 2024 | $3,828 | $374,990 | $0 | $0 |
| 2023 | $4,024 | $396,715 | $0 | $0 |
| 2022 | $4,284 | $417,615 | $0 | $0 |
| 2021 | $3,731 | $558,300 | $111,900 | $446,400 |
| 2020 | $3,696 | $535,100 | $101,700 | $433,400 |
| 2019 | $3,178 | $469,600 | $92,700 | $376,900 |
| 2018 | $3,108 | $437,200 | $85,900 | $351,300 |
| 2017 | $3,077 | $229,680 | $0 | $0 |
| 2016 | $2,768 | $205,370 | $0 | $0 |
| 2015 | $1,108 | $81,730 | $0 | $0 |
| 2014 | $853 | $61,800 | $0 | $0 |
Source: Public Records
Map
Nearby Homes
- 161 W 250 S
- 213 W 250 S
- 473 W 350 S Unit 31
- 1893 Heather Rd
- 889 Sego Lily Way
- 873 S Sunflower Ln
- 2113 W Autumn Dr
- 1862 W Charlotte Ct
- 1755 S 1850 W
- 1766 S 1850 W Unit 8
- 358 N 2810 E
- 2101 W 325 S
- 674 S Meade St
- 1810 W 300 S Unit A
- 442 S Doubleday St
- 662 N Plainsman Dr Unit 101
- Spruce Plan at Shelly Acres Subdivision
- Sycamore Plan at Shelly Acres Subdivision
- Juniper Plan at Shelly Acres Subdivision
- Evergreen Plan at Shelly Acres Subdivision
- 1943 W Yarrow Dr Unit L3
- 1943 W Yarrow Dr
- 1927 W Yarrow Dr
- 1967 W Yarrow Dr Unit L2
- 1927 Yarrow Dr
- 1911 W Yarrow Dr
- 1904 W Yarrow Dr S Unit L 7
- 1904 W Yarrow Dr S
- 1904 W Yarrow Dr S Unit L5
- 1123 S Wildflower Ln Unit L-1
- 1123 S Wildflower Ln
- 1078 S Sego Lily Way Unit J14
- 308 W 250 S
- 118 W 250 S
- 76 W 250 S
- 166 W 250 S Unit 21
- 118 W 250 S Unit 20
- 268 W 250 S Unit 23
- 472 W 350 S Unit 28
- 308 W 250 S Unit 24