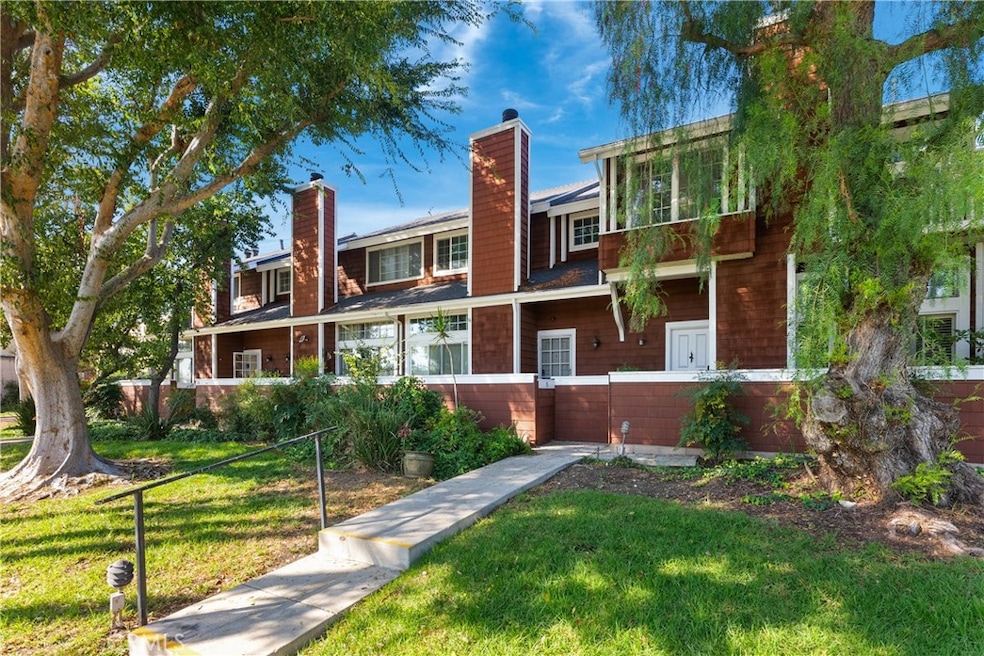
19431 Sherman Way Unit 15 Reseda, CA 91335
Estimated payment $3,089/month
Highlights
- Spa
- Cape Cod Architecture
- Breakfast Area or Nook
- 1.46 Acre Lot
- Granite Countertops
- 2 Car Attached Garage
About This Home
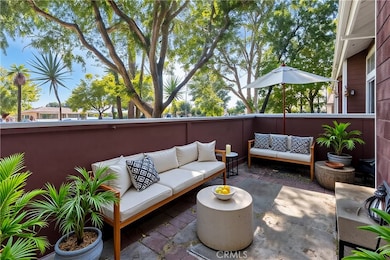
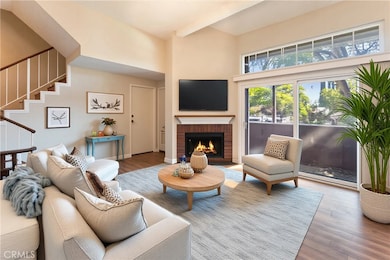
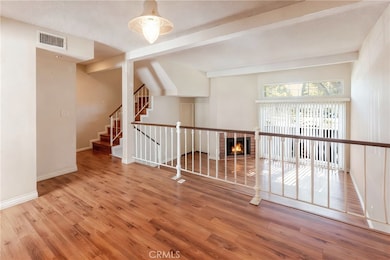
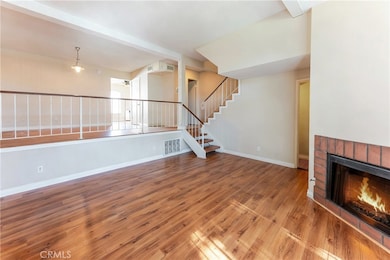
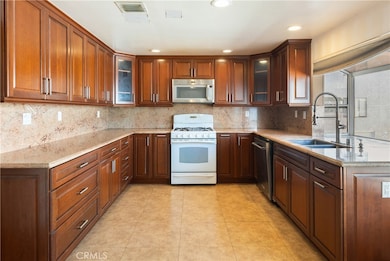
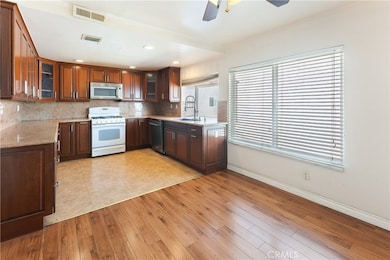
Tremendous Opportunity! Bring your paintbrush and save—this spacious 2BR + 2.5BA townhouse with direct-access 2-car garage offers incredible potential in a desirable Reseda location on Sherman Way. Step through the large front patio into a bright living room featuring high ceilings, a cozy fireplace, and sliding doors that open to the patio for easy indoor-outdoor living. A few steps up lead to the dining area, powder room, and a generous kitchen with a breakfast nook. The kitchen was remodeled less than 10 years ago with KraftMaid soft-closing cabinets, granite countertops, and includes a newer refrigerator. (Microwave hood needs replacing.) Upstairs, you’ll find two ensuite bedrooms, each offering comfort and privacy. The primary suite includes a walk-in closet, additional closet, make-up area, and a bathroom with newer tile shower. The second bedroom also features its own full bathroom.Additional highlights include newer central A/C and heat, ample garage storage, and a basement-like area perfect for extra storage!!
Set in a charming complex with pool and spa, this home is priced to sell and ready for the right buyer to add their personal touch and build equity!
Listing Agent
Rodeo Realty Brokerage Phone: 818-399-7817 License #01261837 Listed on: 10/03/2025

Townhouse Details
Home Type
- Townhome
Est. Annual Taxes
- $2,975
Year Built
- Built in 1979
HOA Fees
- $495 Monthly HOA Fees
Parking
- 2 Car Attached Garage
Home Design
- Cape Cod Architecture
- Entry on the 1st floor
- Cosmetic Repairs Needed
Interior Spaces
- 1,361 Sq Ft Home
- 2-Story Property
- Living Room with Fireplace
- Dining Room
Kitchen
- Breakfast Area or Nook
- Gas Range
- Granite Countertops
Flooring
- Laminate
- Tile
Bedrooms and Bathrooms
- 2 Bedrooms
- All Upper Level Bedrooms
Laundry
- Laundry Room
- Laundry in Garage
Outdoor Features
- Spa
- Patio
- Exterior Lighting
Additional Features
- Two or More Common Walls
- Central Heating and Cooling System
Listing and Financial Details
- Tax Lot 8852
- Tax Tract Number 33715
- Assessor Parcel Number 2116018055
Community Details
Overview
- 36 Units
- Country Walk Association, Phone Number (661) 607-0268
- Valley Association
Recreation
- Community Pool
- Community Spa
Security
- Resident Manager or Management On Site
Map
Home Values in the Area
Average Home Value in this Area
Tax History
| Year | Tax Paid | Tax Assessment Tax Assessment Total Assessment is a certain percentage of the fair market value that is determined by local assessors to be the total taxable value of land and additions on the property. | Land | Improvement |
|---|---|---|---|---|
| 2025 | $2,975 | $243,414 | $68,667 | $174,747 |
| 2024 | $2,975 | $238,642 | $67,321 | $171,321 |
| 2023 | $2,919 | $233,963 | $66,001 | $167,962 |
| 2022 | $2,782 | $229,376 | $64,707 | $164,669 |
| 2021 | $2,741 | $224,880 | $63,439 | $161,441 |
| 2019 | $2,657 | $218,211 | $61,558 | $156,653 |
| 2018 | $2,627 | $213,933 | $60,351 | $153,582 |
| 2016 | $2,579 | $205,627 | $58,008 | $147,619 |
| 2015 | $2,543 | $202,539 | $57,137 | $145,402 |
| 2014 | $2,557 | $198,572 | $56,018 | $142,554 |
Property History
| Date | Event | Price | List to Sale | Price per Sq Ft |
|---|---|---|---|---|
| 10/29/2025 10/29/25 | Price Changed | $445,000 | +4.7% | $327 / Sq Ft |
| 10/03/2025 10/03/25 | For Sale | $425,000 | -- | $312 / Sq Ft |
Purchase History
| Date | Type | Sale Price | Title Company |
|---|---|---|---|
| Deed | -- | None Listed On Document | |
| Deed | -- | -- | |
| Interfamily Deed Transfer | -- | None Available | |
| Grant Deed | $190,000 | Fidelity National Title | |
| Trustee Deed | $182,437 | Accommodation |
Source: California Regional Multiple Listing Service (CRMLS)
MLS Number: SR25231650
APN: 2116-018-055
Disclaimer: Certain information contained herein is derived from information provided by parties other than Homes.com. All information provided is deemed reliable, but is not guaranteed to be accurate and should be independently verified.
![]() The multiple listing data appearing on this website, or contained in reports produced therefrom, is owned and copyrighted by California Regional Multiple Listing Service, Inc. ("CRMLS") and is protected by all applicable copyright laws. Information provided is for viewer's personal, non-commercial use and may not be used for any purpose other than to identify prospective properties the viewer may be interested in purchasing. All listing data, including but not limited to square footage and lot size is believed to be accurate, but the listing Agent, listing Broker and CRMLS and its affiliates do not warrant or guarantee such accuracy. The viewer should independently verify the listed data prior to making any decisions based on such information by personal inspection and/or contacting a real estate professional.
The multiple listing data appearing on this website, or contained in reports produced therefrom, is owned and copyrighted by California Regional Multiple Listing Service, Inc. ("CRMLS") and is protected by all applicable copyright laws. Information provided is for viewer's personal, non-commercial use and may not be used for any purpose other than to identify prospective properties the viewer may be interested in purchasing. All listing data, including but not limited to square footage and lot size is believed to be accurate, but the listing Agent, listing Broker and CRMLS and its affiliates do not warrant or guarantee such accuracy. The viewer should independently verify the listed data prior to making any decisions based on such information by personal inspection and/or contacting a real estate professional.
Based on information from California Regional Multiple Listing Service, Inc. and /or other sources. All data, including all measurements and calculations of area, is obtained from various sources and has not been, and will not be, verified by broker or MLS. All information should be independently reviewed and verified for accuracy. Properties may or may not be listed by the office/agent presenting the information
- 19431 Sherman Way Unit 24
- 19431 Sherman Way Unit 6
- 19350 Sherman Way Unit 103
- 19350 Sherman Way Unit 125
- 19545 Sherman Way Unit 44
- 19545 Sherman Way Unit 99
- 19545 Sherman Way Unit 74
- 19545 Sherman Way Unit 97
- 19545 Sherman Way Unit 66
- 7304 Corbin Ave Unit F
- 7428 Bothwell Rd
- 7420 Corbin Ave Unit 12
- 7306 Jumilla Ave
- 7430 Corbin Ave Unit 19
- 19103 Sherman Way
- 7527 Tampa Ave Unit 1
- 6858 Aura Ave
- 7326 Vanalden Ave
- 7414 Quartz Ave
- 7514 Beckford Ave
- 19344 Wyandotte St
- 19350 Sherman Way Unit 125
- 19350 Sherman Way Unit 137
- 19509 Enadia Way
- 19221 Sherman Way Unit 7
- 7240 Corbin Ave
- 19148 Sherman Way Unit 5
- 7415 Beckford Ave Unit ADU UNIT B
- 19303 Cohasset St
- 7231 Vanalden Ave Unit 7231 Vanalden
- 19330 Saticoy St
- 19050 Sherman Way
- 7009 Jumilla Ave Unit B
- 7425 Vanalden Ave
- 6902 Corbin Ave
- 19017 Gault St Unit 106
- 19009 Sherman Way Unit 29
- 19148 Saticoy St
- 19432 Keswick St
- 19436 Keswick St