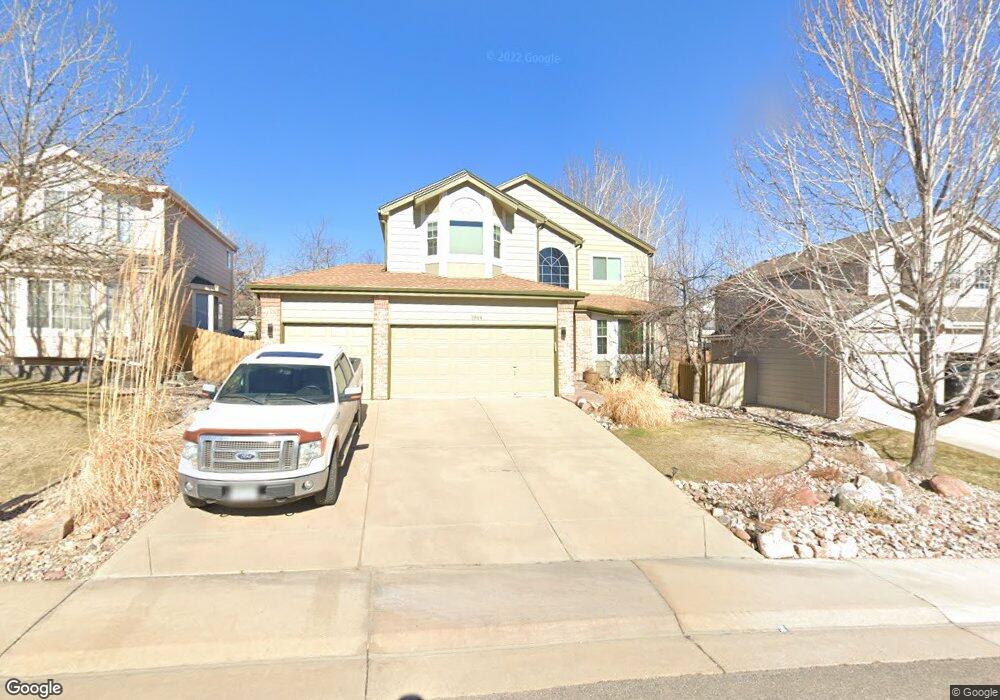
1944 Cedaridge Cir Superior, CO 80027
Estimated Value: $974,017 - $1,109,000
5
Beds
4
Baths
3,338
Sq Ft
$310/Sq Ft
Est. Value
About This Home
This home is located at 1944 Cedaridge Cir, Superior, CO 80027 and is currently estimated at $1,035,504, approximately $310 per square foot. 1944 Cedaridge Cir is a home located in Boulder County with nearby schools including Eldorado K-8 School, Superior Elementary School, and Monarch High School.
Ownership History
Date
Name
Owned For
Owner Type
Purchase Details
Closed on
Sep 3, 2008
Sold by
Kehler Kurtis L and Kehler Terri L
Bought by
Pyatt David W
Current Estimated Value
Home Financials for this Owner
Home Financials are based on the most recent Mortgage that was taken out on this home.
Original Mortgage
$235,000
Outstanding Balance
$155,858
Interest Rate
6.46%
Mortgage Type
Purchase Money Mortgage
Estimated Equity
$879,646
Purchase Details
Closed on
Aug 29, 1997
Sold by
Soderstrom Erik T and Soderstrom Mary Susan
Bought by
Kehler Kurtis L
Home Financials for this Owner
Home Financials are based on the most recent Mortgage that was taken out on this home.
Original Mortgage
$180,000
Interest Rate
7.43%
Mortgage Type
Balloon
Purchase Details
Closed on
Oct 21, 1993
Sold by
Richmond Homes Inc Ii
Bought by
Soderstrom Erik T
Home Financials for this Owner
Home Financials are based on the most recent Mortgage that was taken out on this home.
Original Mortgage
$169,200
Interest Rate
6.79%
Purchase Details
Closed on
Mar 16, 1993
Bought by
Pyatt David W and Pyatt Jill B
Purchase Details
Closed on
Jul 23, 1992
Bought by
Pyatt David W and Pyatt Jill B
Create a Home Valuation Report for This Property
The Home Valuation Report is an in-depth analysis detailing your home's value as well as a comparison with similar homes in the area
Home Values in the Area
Average Home Value in this Area
Purchase History
| Date | Buyer | Sale Price | Title Company |
|---|---|---|---|
| Pyatt David W | $455,000 | Guardian Title | |
| Kehler Kurtis L | $225,000 | Land Title | |
| Soderstrom Erik T | $188,000 | -- | |
| Pyatt David W | -- | -- | |
| Pyatt David W | -- | -- |
Source: Public Records
Mortgage History
| Date | Status | Borrower | Loan Amount |
|---|---|---|---|
| Open | Pyatt David W | $235,000 | |
| Previous Owner | Kehler Kurtis L | $180,000 | |
| Previous Owner | Soderstrom Erik T | $169,200 |
Source: Public Records
Tax History Compared to Growth
Tax History
| Year | Tax Paid | Tax Assessment Tax Assessment Total Assessment is a certain percentage of the fair market value that is determined by local assessors to be the total taxable value of land and additions on the property. | Land | Improvement |
|---|---|---|---|---|
| 2025 | $6,366 | $60,851 | $21,363 | $39,488 |
| 2024 | $6,366 | $60,851 | $21,363 | $39,488 |
| 2023 | $6,279 | $61,439 | $18,881 | $46,243 |
| 2022 | $4,951 | $47,329 | $15,088 | $32,241 |
| 2021 | $5,231 | $51,802 | $16,517 | $35,285 |
| 2020 | $4,932 | $46,940 | $17,017 | $29,923 |
| 2019 | $4,863 | $46,940 | $17,017 | $29,923 |
| 2018 | $4,531 | $43,322 | $11,736 | $31,586 |
| 2017 | $4,631 | $47,896 | $12,975 | $34,921 |
| 2016 | $4,622 | $41,766 | $12,099 | $29,667 |
| 2015 | $4,392 | $36,178 | $13,532 | $22,646 |
| 2014 | $3,841 | $36,178 | $13,532 | $22,646 |
Source: Public Records
Map
Nearby Homes
- 1812 Eldorado Dr
- 2112 Grayden Ct
- 1899 Breen Ln
- 1842 Reliance Cir
- 1637 Reliance Cir
- 1825 Keota Ln
- 1302 Eldorado Dr
- 2204 Lasalle St
- 1122 Eldorado Dr
- 1009 Monarch Way
- 1815 Spaulding Cir Unit 1815
- 2169 Eagle Ave Unit 2169
- 888 Northern Way
- 977 Eldorado Dr
- 882 Eldorado Dr
- 1220 S Boyero Ct
- 1820 Vernon Ln
- 1485 Stoneham St
- 2225 Clayton Cir
- 1340 Stoneham St
- 1954 Cedaridge Cir
- 1934 Cedaridge Cir
- 1897 Eldorado Dr
- 1887 Eldorado Dr
- 1964 Cedaridge Cir
- 1924 Cedaridge Cir
- 1907 Eldorado Dr
- 1867 Eldorado Dr
- 1959 Cedaridge Cir
- 1917 Eldorado Dr
- 1949 Cedaridge Cir
- 1984 Cedaridge Cir
- 1914 Cedaridge Cir
- 1979 Cedaridge Cir
- 1847 Eldorado Dr
- 1929 Cedaridge Cir
- 1927 Eldorado Dr
- 1989 Cedaridge Cir
- 1827 Eldorado Dr
- 1904 Cedaridge Cir