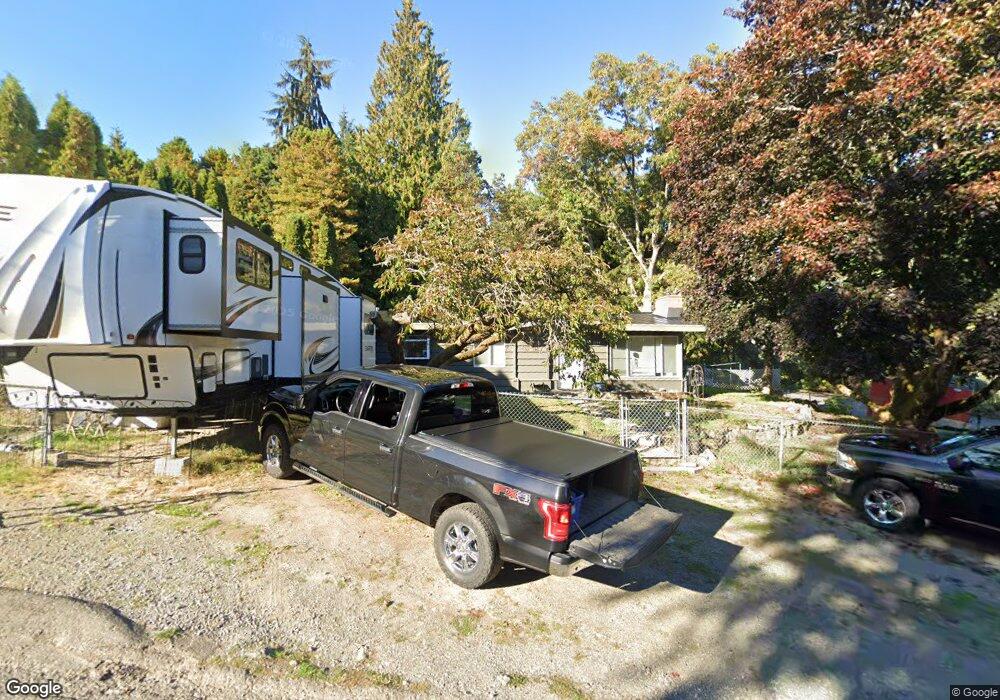
1944 NE Calhoun St Bremerton, WA 98310
Estimated Value: $423,000 - $517,000
3
Beds
2
Baths
1,554
Sq Ft
$299/Sq Ft
Est. Value
About This Home
This home is located at 1944 NE Calhoun St, Bremerton, WA 98310 and is currently estimated at $464,421, approximately $298 per square foot. 1944 NE Calhoun St is a home located in Kitsap County with nearby schools including View Ridge Elementary School, Mountain View Middle School, and Bremerton High School.
Ownership History
Date
Name
Owned For
Owner Type
Purchase Details
Closed on
Oct 14, 2019
Sold by
Jeffries Jamie Leigh and Jeffries Charles
Bought by
Jeffries Charles
Current Estimated Value
Home Financials for this Owner
Home Financials are based on the most recent Mortgage that was taken out on this home.
Original Mortgage
$225,150
Outstanding Balance
$197,243
Interest Rate
3.5%
Mortgage Type
New Conventional
Estimated Equity
$267,178
Purchase Details
Closed on
Oct 7, 2019
Sold by
Jeffries Tammy S
Bought by
Jeffries Charles
Home Financials for this Owner
Home Financials are based on the most recent Mortgage that was taken out on this home.
Original Mortgage
$225,150
Outstanding Balance
$197,243
Interest Rate
3.5%
Mortgage Type
New Conventional
Estimated Equity
$267,178
Purchase Details
Closed on
Sep 29, 2018
Sold by
Jeffries John D
Bought by
Jeffries Tammy Sue
Create a Home Valuation Report for This Property
The Home Valuation Report is an in-depth analysis detailing your home's value as well as a comparison with similar homes in the area
Home Values in the Area
Average Home Value in this Area
Purchase History
| Date | Buyer | Sale Price | Title Company |
|---|---|---|---|
| Jeffries Charles | -- | Attorneys Ttl Of Kitsap Port | |
| Jeffries Charles | $237,000 | Attorneys Ttl Of Kitsap Port | |
| Jeffries Tammy Sue | -- | None Available |
Source: Public Records
Mortgage History
| Date | Status | Borrower | Loan Amount |
|---|---|---|---|
| Open | Jeffries Charles | $225,150 |
Source: Public Records
Tax History Compared to Growth
Tax History
| Year | Tax Paid | Tax Assessment Tax Assessment Total Assessment is a certain percentage of the fair market value that is determined by local assessors to be the total taxable value of land and additions on the property. | Land | Improvement |
|---|---|---|---|---|
| 2026 | $3,829 | $381,960 | $105,600 | $276,360 |
| 2025 | $3,829 | $381,960 | $105,600 | $276,360 |
| 2024 | $3,700 | $381,960 | $105,600 | $276,360 |
| 2023 | $3,712 | $381,960 | $105,600 | $276,360 |
| 2022 | $3,528 | $321,040 | $88,000 | $233,040 |
| 2021 | $2,931 | $248,920 | $58,560 | $190,360 |
| 2020 | $3,275 | $289,010 | $54,610 | $234,400 |
| 2019 | $2,997 | $262,140 | $49,070 | $213,070 |
| 2018 | $3,140 | $202,960 | $39,570 | $163,390 |
| 2017 | $2,790 | $202,960 | $39,570 | $163,390 |
| 2016 | $2,604 | $179,600 | $34,710 | $144,890 |
| 2015 | $2,131 | $149,580 | $35,160 | $114,420 |
| 2014 | -- | $144,530 | $35,160 | $109,370 |
| 2013 | -- | $154,070 | $37,630 | $116,440 |
Source: Public Records
Map
Nearby Homes
- 1802 NE Windermere Dr
- 4209 Westview Dr NE
- 1800 NE Riddell Rd
- 4435 Fir Dr NE
- 1312 E Hope St
- 3525 Harbel Dr NE
- 3467 Partridge Hollow NE
- 4808 Charmont Ln NE
- 3709 Trenton Ave NE
- 3975 Fischer Park Ave NE
- 123 Illahee Rd NE
- 0 Illahee Rd NE Unit NWM2449458
- 36 Illahee Rd NE
- 3316 Perry Ave
- 3927 NE Steinman Ln
- 3621 Wheaton Way
- 3335 Trenton Ave
- 5307 Washington 303 Unit 126
- 3237 Perry Ave NE
- 704 NE Normandy Dr
- 1936 NE Calhoun St
- 4407 Forest Dr NE
- 1943 NE Calhoun St
- 4404 Forest Dr NE
- 4400 Forest Dr NE
- 4411 Forest Dr NE
- 1928 NE Calhoun St
- 1935 NE Calhoun St
- 4423 Audree Ln NE
- 4433 Forest Dr NE
- 1927 NE Calhoun St
- 4408 Forest Dr NE
- 4310 Forest Dr NE
- 4404 Olympus Dr NE
- 1936 NE Clemens St
- 4410 Olympus Dr NE
- 4427 Audree Ln NE
- 4401 Robinson Rd NE
- 4418 Olympus Dr NE
- 1928 NE Clemens St