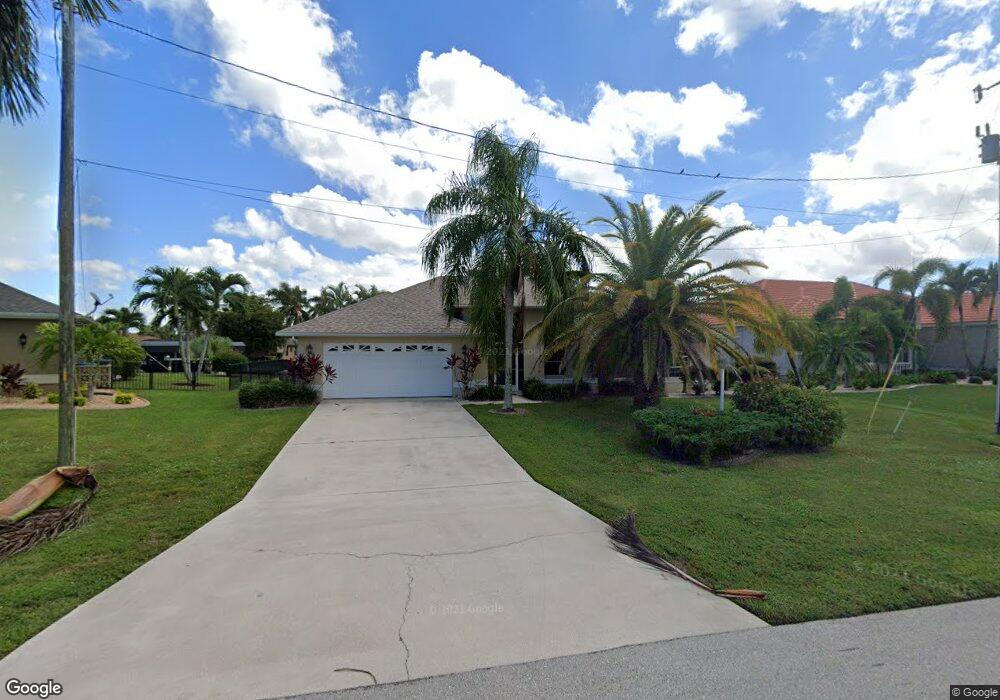
1944 SE 21st St Unit 89 Cape Coral, FL 33990
Hancock NeighborhoodEstimated Value: $429,000 - $708,000
3
Beds
2
Baths
2,052
Sq Ft
$285/Sq Ft
Est. Value
About This Home
This home is located at 1944 SE 21st St Unit 89, Cape Coral, FL 33990 and is currently estimated at $585,829, approximately $285 per square foot. 1944 SE 21st St Unit 89 is a home located in Lee County with nearby schools including Caloosa Elementary School, Cape Elementary School, and Tropic Isles Elementary School.
Ownership History
Date
Name
Owned For
Owner Type
Purchase Details
Closed on
Nov 29, 2019
Sold by
Gerrero Elaine J
Bought by
Gill Kathleen A
Current Estimated Value
Purchase Details
Closed on
Feb 16, 2018
Sold by
Gennepu Robert D
Bought by
Ceonepo Elanine J
Purchase Details
Closed on
Dec 29, 2010
Sold by
Gerrero Elaine J
Bought by
Gill Kathleen A
Purchase Details
Closed on
Jan 12, 2004
Sold by
Paoli Frank and Paoli Irene E
Bought by
Gerrero Elaine J and Gill Kathleen A
Home Financials for this Owner
Home Financials are based on the most recent Mortgage that was taken out on this home.
Original Mortgage
$228,000
Interest Rate
6.03%
Purchase Details
Closed on
May 30, 2002
Sold by
Koplinger Manfred and Koplinger Hanna Annelene
Bought by
Paoli Frank and Paoli Irene E
Home Financials for this Owner
Home Financials are based on the most recent Mortgage that was taken out on this home.
Original Mortgage
$100,000
Interest Rate
6.85%
Create a Home Valuation Report for This Property
The Home Valuation Report is an in-depth analysis detailing your home's value as well as a comparison with similar homes in the area
Home Values in the Area
Average Home Value in this Area
Purchase History
| Date | Buyer | Sale Price | Title Company |
|---|---|---|---|
| Gill Kathleen A | -- | None Available | |
| Ceonepo Elanine J | -- | Attorney | |
| Gill Kathleen A | $86,500 | None Available | |
| Gerrero Elaine J | $285,000 | -- | |
| Paoli Frank | $255,000 | -- |
Source: Public Records
Mortgage History
| Date | Status | Borrower | Loan Amount |
|---|---|---|---|
| Previous Owner | Gerrero Elaine J | $228,000 | |
| Previous Owner | Paoli Frank | $100,000 |
Source: Public Records
Tax History Compared to Growth
Tax History
| Year | Tax Paid | Tax Assessment Tax Assessment Total Assessment is a certain percentage of the fair market value that is determined by local assessors to be the total taxable value of land and additions on the property. | Land | Improvement |
|---|---|---|---|---|
| 2025 | $5,066 | $323,158 | -- | -- |
| 2024 | $4,903 | $314,051 | -- | -- |
| 2023 | $4,903 | $299,904 | $0 | $0 |
| 2022 | $4,697 | $296,023 | $0 | $0 |
| 2021 | $4,851 | $312,345 | $103,769 | $208,576 |
| 2020 | $4,938 | $283,433 | $120,000 | $163,433 |
| 2019 | $5,347 | $266,476 | $120,000 | $146,476 |
| 2018 | $5,502 | $268,893 | $110,000 | $158,893 |
| 2017 | $5,250 | $250,317 | $96,000 | $154,317 |
| 2016 | $5,168 | $245,258 | $98,659 | $146,599 |
| 2015 | $4,869 | $227,509 | $96,422 | $131,087 |
| 2014 | $4,618 | $201,599 | $69,582 | $132,017 |
| 2013 | -- | $210,788 | $66,050 | $144,738 |
Source: Public Records
Map
Nearby Homes
- 1822 SE 20th St
- 1944 Four Mile Cove Pkwy
- 2022 Four Mile Cove Pkwy
- 2027 SE 21st St
- 1814 Four Mile Cove Pkwy
- 2031 SE 21st St
- 1763 Four Mile Cove Pkwy Unit 611
- 1952 SE 21st Ct
- 2017 SE 17th Place
- 2118 SE 18th Ave
- 1769 Four Mile Cove Pkwy Unit 915
- 1769 Four Mile Cove Pkwy Unit 911
- 1787 Four Mile Cove Pkwy Unit 431
- 1791 Four Mile Cove Pkwy Unit 624
- 1791 Four Mile Cove Pkwy Unit 612
- 1791 Four Mile Cove Pkwy Unit 625
- 1791 Four Mile Cove Pkwy Unit 644
- 2127 SE 17th Place
- 1795 Four Mile Cove Pkwy Unit 825
- 1773 Four Mile Cove Pkwy Unit 1123
- 1940 SE 21st St
- 1948 SE 21st St
- 1936 SE 21st St
- 1943 SE 21st St
- 1939 SE 21st St
- 2011 SE 20th Ln
- 2009 SE 20th Ln
- 1945 SE 19th Ln
- 1935 SE 21st St
- 2015 SE 20th Ln
- 1932 SE 21st St
- 1931 SE 21st St
- 2019 SE 20th Ln
- 1932 SE 20th Ln
- 1928 SE 20th Ln
- 2001 SE 20th Ln
- 1935 SE 19th Ln
- 1922 SE 20th Ln
- 1926 SE 21st St
- 1927 SE 21st St