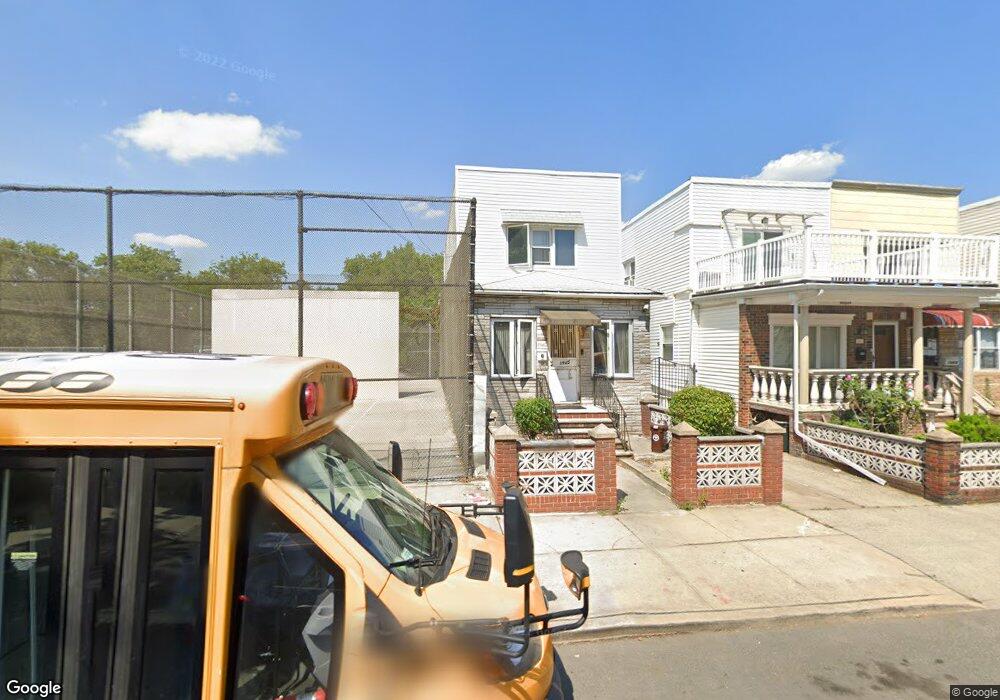
1945 77th St Brooklyn, NY 11214
Bensonhurst NeighborhoodEstimated Value: $1,034,235 - $1,178,000
Studio
--
Bath
1,408
Sq Ft
$802/Sq Ft
Est. Value
About This Home
This home is located at 1945 77th St, Brooklyn, NY 11214 and is currently estimated at $1,128,809, approximately $801 per square foot. 1945 77th St is a home located in Kings County with nearby schools including P.S. 186 Dr. Irving A. Gladstone Elementary School, Seth Low Intermediate School 96, and New Utrecht High School.
Ownership History
Date
Name
Owned For
Owner Type
Purchase Details
Closed on
Dec 21, 2017
Sold by
Chan Chiuyi
Bought by
Chan Chiuyi and Chan Yukong
Current Estimated Value
Purchase Details
Closed on
Aug 20, 2002
Sold by
Cilone Michael F
Bought by
Chan Chiuyi
Home Financials for this Owner
Home Financials are based on the most recent Mortgage that was taken out on this home.
Original Mortgage
$180,000
Interest Rate
6.2%
Mortgage Type
Purchase Money Mortgage
Create a Home Valuation Report for This Property
The Home Valuation Report is an in-depth analysis detailing your home's value as well as a comparison with similar homes in the area
Home Values in the Area
Average Home Value in this Area
Purchase History
| Date | Buyer | Sale Price | Title Company |
|---|---|---|---|
| Chan Chiuyi | -- | -- | |
| Chan Chiuyi | -- | -- |
Source: Public Records
Mortgage History
| Date | Status | Borrower | Loan Amount |
|---|---|---|---|
| Previous Owner | Chan Chiuyi | $180,000 |
Source: Public Records
Tax History
| Year | Tax Paid | Tax Assessment Tax Assessment Total Assessment is a certain percentage of the fair market value that is determined by local assessors to be the total taxable value of land and additions on the property. | Land | Improvement |
|---|---|---|---|---|
| 2025 | $6,997 | $62,820 | $12,300 | $50,520 |
| 2024 | $6,997 | $67,140 | $12,300 | $54,840 |
| 2023 | $7,075 | $68,160 | $12,300 | $55,860 |
| 2022 | $6,846 | $58,800 | $12,300 | $46,500 |
| 2021 | $6,808 | $58,500 | $12,300 | $46,200 |
| 2019 | $6,073 | $52,740 | $12,300 | $40,440 |
| 2017 | $5,825 | $28,577 | $6,757 | $21,820 |
| 2016 | $5,390 | $26,960 | $7,113 | $19,847 |
| 2015 | $3,252 | $25,435 | $9,399 | $16,036 |
| 2014 | $3,252 | $24,192 | $8,499 | $15,693 |
Source: Public Records
Map
Nearby Homes
- 1927 78th St Unit 4A
- 1912 Bay Ridge Pkwy
- 2039 78th St
- 1939 80th St
- 1827 78th St Unit 1B
- 7322 19th Ave
- 1839 79th St Unit 1B
- 1859 80th St
- 7308 19th Ave
- 1973 81st St Unit C10
- 2024 80th St
- 1858 73rd St
- 2040 73rd St
- 2101 76th St
- 7801 18th Ave
- 1918 72nd St
- 7616 18th Ave
- 7405 18 Ave
- 7201 20th Ave
- 7405 18th Ave
Your Personal Tour Guide
Ask me questions while you tour the home.