Estimated Value: $629,000 - $801,000
3
Beds
2
Baths
1,824
Sq Ft
$383/Sq Ft
Est. Value
About This Home
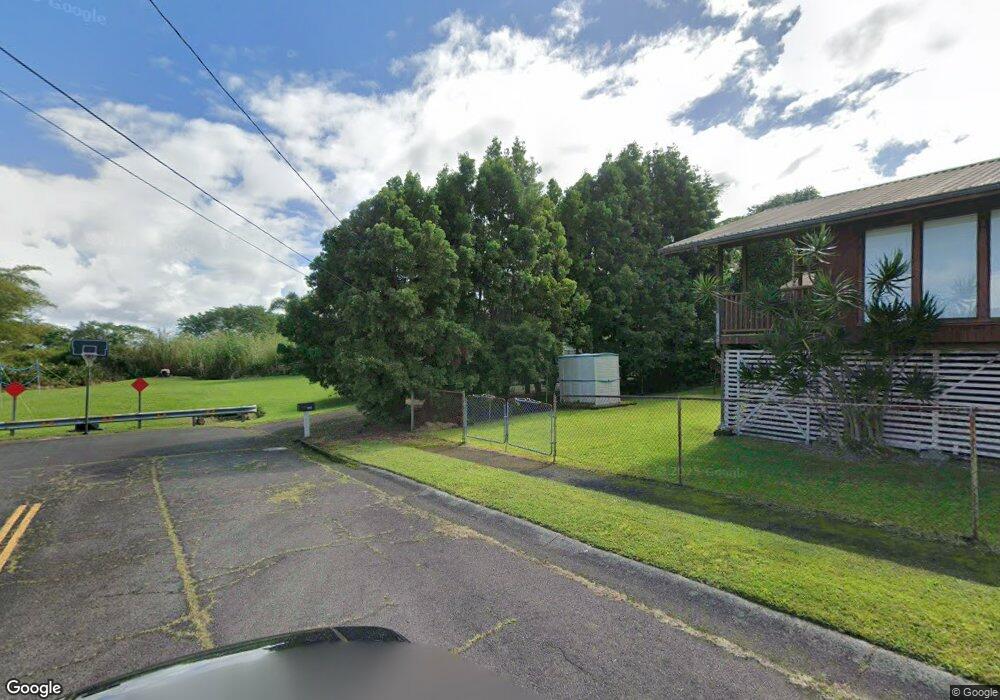
This home is located at 1945 Keo St, Hilo, HI 96720 and is currently estimated at $698,932, approximately $383 per square foot. 1945 Keo St is a home located in Hawaii County with nearby schools including Ka'umana Elementary School, Hilo Intermediate School, and Hilo High School.
Ownership History
Date
Name
Owned For
Owner Type
Purchase Details
Closed on
Nov 4, 2021
Sold by
Arthur Pinkney J
Bought by
Wells Fargo Bank Na
Current Estimated Value
Purchase Details
Closed on
Aug 23, 2017
Sold by
Hilo Partners Jv
Bought by
Puainako Heights Land Investment Llc
Purchase Details
Closed on
Apr 13, 2009
Sold by
Knight Bruce A and Knight Zenaida A
Bought by
Pinkney J Arthur and Pinkney Francisca Emefiene
Home Financials for this Owner
Home Financials are based on the most recent Mortgage that was taken out on this home.
Original Mortgage
$348,570
Interest Rate
5.17%
Mortgage Type
FHA
Purchase Details
Closed on
Jul 12, 2004
Sold by
Correia Steven A
Bought by
Knight Bruce A and Knight Zenaida A
Home Financials for this Owner
Home Financials are based on the most recent Mortgage that was taken out on this home.
Original Mortgage
$203,250
Interest Rate
6.27%
Mortgage Type
Purchase Money Mortgage
Purchase Details
Closed on
Dec 21, 2001
Sold by
Kushi Lynne K
Bought by
Correia Steven A
Create a Home Valuation Report for This Property
The Home Valuation Report is an in-depth analysis detailing your home's value as well as a comparison with similar homes in the area
Home Values in the Area
Average Home Value in this Area
Purchase History
| Date | Buyer | Sale Price | Title Company |
|---|---|---|---|
| Wells Fargo Bank Na | -- | Tmlf Hawaii Lllc | |
| Wells Fargo Bank Na | -- | Tmlf Hawaii Lllc | |
| Puainako Heights Land Investment Llc | $1,500 | None Available | |
| Pinkney J Arthur | $355,000 | Tg | |
| Knight Bruce A | $271,000 | -- | |
| Correia Steven A | $20,500 | -- |
Source: Public Records
Mortgage History
| Date | Status | Borrower | Loan Amount |
|---|---|---|---|
| Previous Owner | Pinkney J Arthur | $348,570 | |
| Previous Owner | Knight Bruce A | $203,250 |
Source: Public Records
Tax History Compared to Growth
Tax History
| Year | Tax Paid | Tax Assessment Tax Assessment Total Assessment is a certain percentage of the fair market value that is determined by local assessors to be the total taxable value of land and additions on the property. | Land | Improvement |
|---|---|---|---|---|
| 2025 | $2,159 | $569,500 | $117,000 | $452,500 |
| 2024 | $2,159 | $552,900 | $117,000 | $435,900 |
| 2023 | $2,133 | $536,800 | $117,000 | $419,800 |
| 2022 | $3,260 | $530,100 | $110,300 | $419,800 |
| 2021 | $5,098 | $459,300 | $92,300 | $367,000 |
| 2020 | $1,679 | $433,000 | $90,300 | $342,700 |
| 2019 | $1,601 | $420,400 | $90,300 | $330,100 |
| 2018 | $4,451 | $401,000 | $85,300 | $315,700 |
| 2017 | $1,362 | $376,800 | $77,800 | $299,000 |
| 2016 | $1,553 | $365,800 | $77,800 | $288,000 |
| 2015 | $1,292 | $355,100 | $77,800 | $277,300 |
| 2014 | $1,292 | $350,700 | $77,800 | $272,900 |
Source: Public Records
Map
Nearby Homes
- 103 Puhili St
- 52 S Wilder Rd
- 15 Amau Rd
- 15-1144 Amau Rd
- 435 Kaumana Dr
- 2114 Kaumana Dr
- 1360 Kaumana Dr
- 1379 Mele Manu St
- 0 Puainako St Extension Unit 720370
- 40 Akolea Rd
- 0 Akolea Rd Unit 723221
- 1162 Kaumana Dr
- 564 Hoaka Rd
- 144 Chong St
- 52 Wawai Loop
- 187 Hokulani St
- 7 Kaapuni Loop
- 956 Kaumana Dr
- 939 Kaumana Dr
- 883 Hele Mauna St