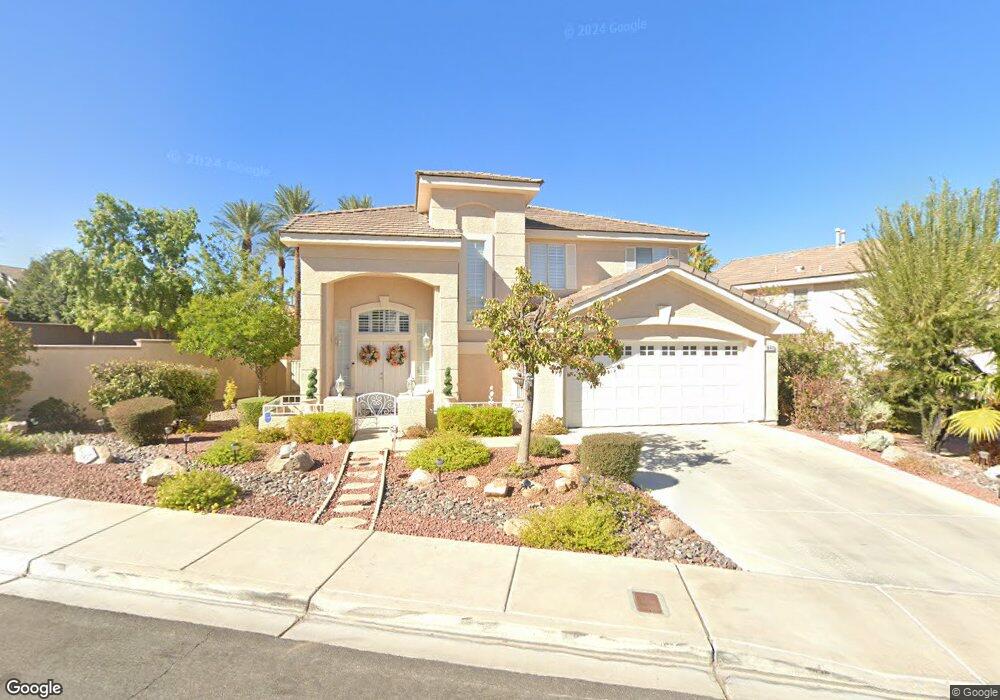
1945 Thunder Ridge Cir Henderson, NV 89012
Green Valley Ranch NeighborhoodEstimated Value: $506,000 - $559,000
4
Beds
3
Baths
1,969
Sq Ft
$271/Sq Ft
Est. Value
About This Home
This home is located at 1945 Thunder Ridge Cir, Henderson, NV 89012 and is currently estimated at $534,497, approximately $271 per square foot. 1945 Thunder Ridge Cir is a home located in Clark County with nearby schools including John Vanderburg Elementary School, Neil C. Twitchell Elementary School, and Bob Miller Middle School.
Ownership History
Date
Name
Owned For
Owner Type
Purchase Details
Closed on
Aug 30, 2018
Sold by
Valentino Madeline
Bought by
Valentino Madeline and Mdak Living Trust
Current Estimated Value
Purchase Details
Closed on
Dec 9, 2017
Sold by
Valentino Austin Joseph and Valentino Madeline
Bought by
Valentino Madeline
Home Financials for this Owner
Home Financials are based on the most recent Mortgage that was taken out on this home.
Original Mortgage
$218,700
Outstanding Balance
$184,126
Interest Rate
3.94%
Mortgage Type
New Conventional
Estimated Equity
$350,371
Purchase Details
Closed on
Jul 14, 1998
Sold by
N & N Thunder Ridge Iv
Bought by
Valentino Austin J and Valentino Madeline
Home Financials for this Owner
Home Financials are based on the most recent Mortgage that was taken out on this home.
Original Mortgage
$140,750
Interest Rate
7%
Create a Home Valuation Report for This Property
The Home Valuation Report is an in-depth analysis detailing your home's value as well as a comparison with similar homes in the area
Home Values in the Area
Average Home Value in this Area
Purchase History
| Date | Buyer | Sale Price | Title Company |
|---|---|---|---|
| Valentino Madeline | -- | None Available | |
| Valentino Madeline | -- | None Available | |
| Valentino Austin J | $153,500 | United Title |
Source: Public Records
Mortgage History
| Date | Status | Borrower | Loan Amount |
|---|---|---|---|
| Open | Valentino Madeline | $218,700 | |
| Closed | Valentino Austin J | $140,750 |
Source: Public Records
Tax History Compared to Growth
Tax History
| Year | Tax Paid | Tax Assessment Tax Assessment Total Assessment is a certain percentage of the fair market value that is determined by local assessors to be the total taxable value of land and additions on the property. | Land | Improvement |
|---|---|---|---|---|
| 2025 | $2,156 | $112,394 | $44,800 | $67,594 |
| 2024 | $2,093 | $112,394 | $44,800 | $67,594 |
| 2023 | $2,093 | $99,598 | $35,350 | $64,248 |
| 2022 | $2,032 | $91,620 | $32,900 | $58,720 |
| 2021 | $1,973 | $85,759 | $29,750 | $56,009 |
| 2020 | $1,913 | $85,366 | $29,750 | $55,616 |
| 2019 | $1,857 | $80,932 | $26,250 | $54,682 |
| 2018 | $1,803 | $74,180 | $21,700 | $52,480 |
| 2017 | $2,121 | $73,119 | $19,950 | $53,169 |
| 2016 | $1,708 | $67,730 | $14,000 | $53,730 |
| 2015 | $1,704 | $66,319 | $13,300 | $53,019 |
| 2014 | $1,654 | $62,839 | $9,100 | $53,739 |
Source: Public Records
Map
Nearby Homes
- 261 Horizon Pointe Cir
- 254 Horizon Pointe Cir
- 338 Pleasant Summit Dr
- 1870 Desert Forest Way
- 314 Dazzling Terrace
- 2035 Poppywood Ave
- 345 Lingering Ln
- 2004 Poppywood Ave
- 1887 Eagle Flight Ln
- 259 Rockwell Springs Ct
- 256 Canyon Spirit Dr
- 254 Rockwell Springs Ct
- 466 Edgefield Ridge Place
- 286 Fairmeadow St
- 1798 Lakewood Dr
- 2079 Poppywood Ave
- 208 Sandpiper Village Way
- 335 Rose Petal Ct
- 2093 High Mesa Dr
- 498 Elm Crest Place
- 1941 Thunder Ridge Cir
- 1937 Thunder Ridge Cir
- 1949 Thunder Ridge Cir
- 1944 Thunder Ridge Cir
- 266 Horizon Pointe Cir
- 272 Horizon Pointe Cir
- 272 Horizon Pointe Cir
- 1942 Thunder Ridge Cir
- 1940 Thunder Ridge Cir
- 1938 Thunder Ridge Cir
- 1935 Thunder Ridge Cir
- 1951 Thunder Ridge Cir
- 1948 Thunder Ridge Cir
- 1936 Thunder Ridge Cir
- 274 Horizon Pointe Cir
- 264 Horizon Pointe Cir
- 1950 Thunder Ridge Cir
- 1934 Thunder Ridge Cir
- 1933 Thunder Ridge Cir
- 269 Horizon Pointe Cir