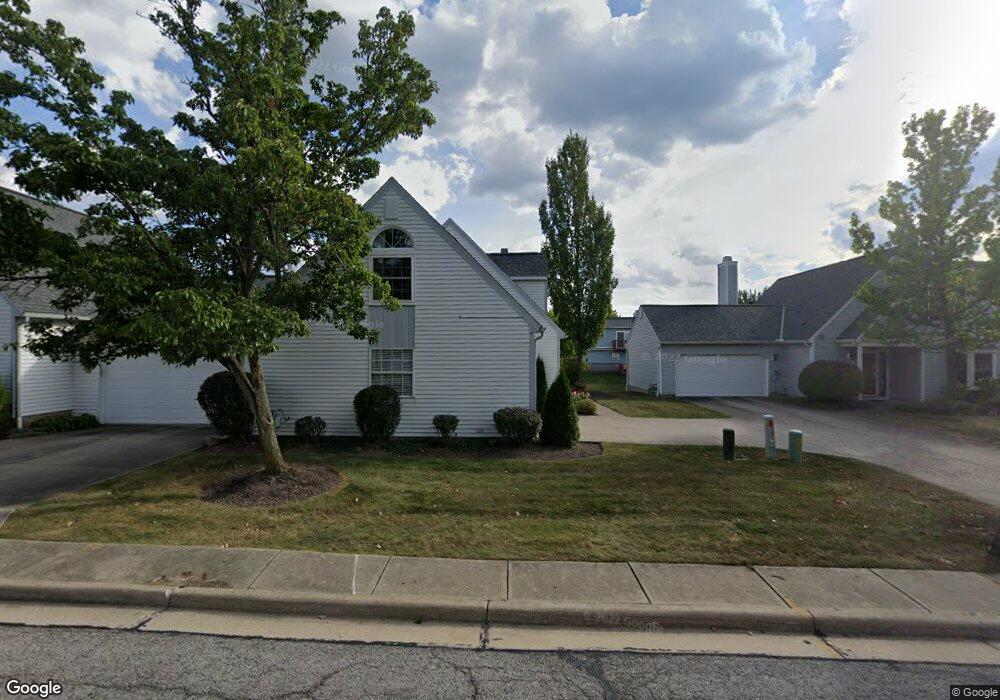
19457 Lymans Ln Unit 96 Strongsville, OH 44149
Estimated Value: $253,997 - $271,000
2
Beds
2
Baths
1,546
Sq Ft
$168/Sq Ft
Est. Value
About This Home
This home is located at 19457 Lymans Ln Unit 96, Strongsville, OH 44149 and is currently estimated at $259,499, approximately $167 per square foot. 19457 Lymans Ln Unit 96 is a home located in Cuyahoga County with nearby schools including Strongsville High School, Strongsville Academy, and Sts Joseph & John Interparochial School.
Ownership History
Date
Name
Owned For
Owner Type
Purchase Details
Closed on
Jul 5, 2017
Sold by
Macleod Macleod C and Macleod Violet G
Bought by
Macleod Violet G
Current Estimated Value
Purchase Details
Closed on
May 21, 2007
Sold by
Ivanov Oleksandr and Romankiv Iryna
Bought by
Macleod Douglas and Macleod Violet G
Home Financials for this Owner
Home Financials are based on the most recent Mortgage that was taken out on this home.
Original Mortgage
$107,100
Outstanding Balance
$65,323
Interest Rate
6.22%
Mortgage Type
Purchase Money Mortgage
Estimated Equity
$194,176
Purchase Details
Closed on
Feb 19, 2003
Sold by
Sullivan Robin R
Bought by
Ivanov Oleksandr and Romankiv Iryna
Home Financials for this Owner
Home Financials are based on the most recent Mortgage that was taken out on this home.
Original Mortgage
$108,800
Interest Rate
6.07%
Purchase Details
Closed on
Jan 1, 1992
Bought by
Sullivan Sullivan W and Sullivan R
Create a Home Valuation Report for This Property
The Home Valuation Report is an in-depth analysis detailing your home's value as well as a comparison with similar homes in the area
Home Values in the Area
Average Home Value in this Area
Purchase History
| Date | Buyer | Sale Price | Title Company |
|---|---|---|---|
| Macleod Violet G | -- | None Available | |
| Macleod Douglas | $153,000 | Signature Title | |
| Ivanov Oleksandr | $136,000 | Real Living Title Agency Ltd | |
| Sullivan Sullivan W | -- | -- |
Source: Public Records
Mortgage History
| Date | Status | Borrower | Loan Amount |
|---|---|---|---|
| Open | Macleod Douglas | $107,100 | |
| Closed | Ivanov Oleksandr | $108,800 |
Source: Public Records
Tax History Compared to Growth
Tax History
| Year | Tax Paid | Tax Assessment Tax Assessment Total Assessment is a certain percentage of the fair market value that is determined by local assessors to be the total taxable value of land and additions on the property. | Land | Improvement |
|---|---|---|---|---|
| 2024 | $3,500 | $74,550 | $7,840 | $66,710 |
| 2023 | $3,487 | $55,690 | $5,600 | $50,090 |
| 2022 | $3,462 | $55,685 | $5,600 | $50,085 |
| 2021 | $3,434 | $55,690 | $5,600 | $50,090 |
| 2020 | $2,940 | $42,180 | $4,240 | $37,940 |
| 2019 | $2,854 | $120,500 | $12,100 | $108,400 |
| 2018 | $1,295 | $42,180 | $4,240 | $37,940 |
| 2017 | $2,749 | $41,440 | $4,060 | $37,380 |
| 2016 | $2,727 | $41,440 | $4,060 | $37,380 |
| 2015 | $2,973 | $41,440 | $4,060 | $37,380 |
| 2014 | $2,973 | $44,560 | $4,380 | $40,180 |
Source: Public Records
Map
Nearby Homes
- 14112 Settlers Way
- 19620 Porters Ln Unit 15F
- 19160 Wheelers Ln
- 20078 Trapper Trail
- 19513 Lunn Rd
- 13156 Olympus Way
- 13099 Olympus Way
- 13066 Olympus Way
- 13236 Tomson Dr
- 18630 Shurmer Rd
- 12694 Ionia Ct
- 12539 Olympus Way
- 15017 Regency Dr
- 12647 Edgepark Cir
- 12385 Corinth Ct
- 15279 Walnut Creek Dr
- 14896 Britannia Ct
- 12651 Alameda Dr
- 20678 Spruce Dr
- 14400 Prospect Rd
- 19445 Lymans Ln Unit AG97
- 19461 Lymans Ln Unit AF95
- 19477 Lymans Ln
- 19441 Lymans Ln Unit AG98
- 19413 Lymans Ln
- 19413 Lymans Ln Unit 99
- 14386 Settlers Way Unit 106
- 19452 Lymans Ln
- 19468 Lymans Ln
- 19468 Lymans Ln Unit 92
- 19436 Lymans Ln
- 19436 Lymans Ln Unit 90
- 14408 Settlers Way
- 14408 Settlers Way Unit 105
- 14364 Settlers Way Unit 107
- 14496 Settlers Way Unit AH101
- 19489 Lymans Ln Unit R55
- 19484 Lymans Ln
- 19379 Lymans Ln Unit AG100
- 14430 Settlers Way Unit AH104