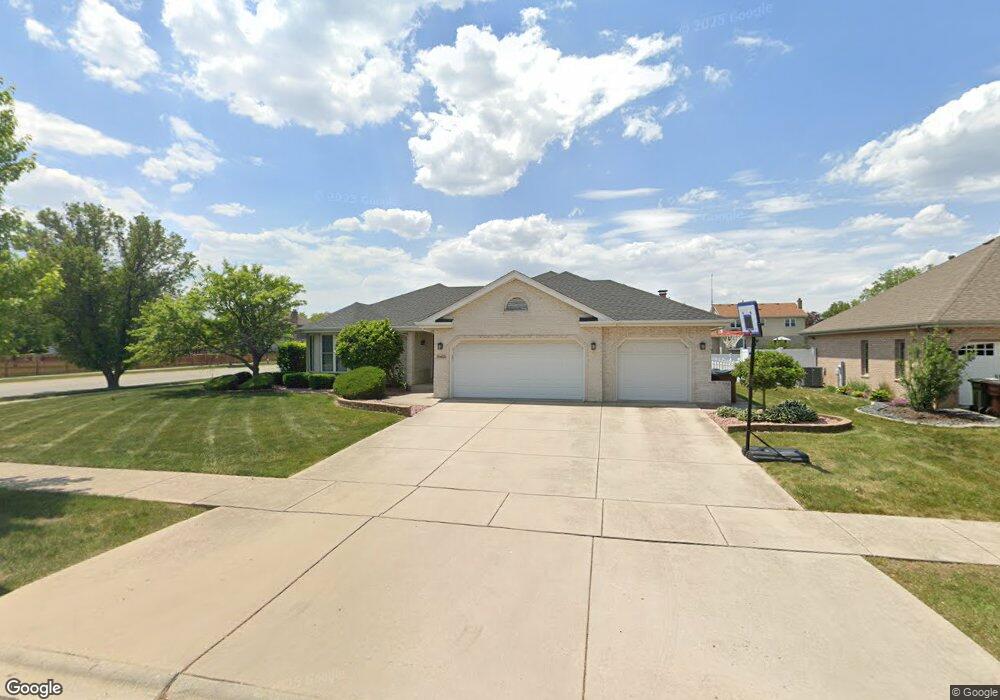
19458 Stonehenge Dr Mokena, IL 60448
Estimated Value: $488,000 - $514,000
4
Beds
4
Baths
2,574
Sq Ft
$195/Sq Ft
Est. Value
About This Home
This home is located at 19458 Stonehenge Dr, Mokena, IL 60448 and is currently estimated at $502,168, approximately $195 per square foot. 19458 Stonehenge Dr is a home located in Will County with nearby schools including Mokena Elementary School, Mokena Intermediate School, and Mokena Jr High School.
Ownership History
Date
Name
Owned For
Owner Type
Purchase Details
Closed on
Jan 20, 2005
Sold by
Lee David T and Lee Jennifer A
Bought by
Abuata Mohd and Abuata Nadia
Current Estimated Value
Home Financials for this Owner
Home Financials are based on the most recent Mortgage that was taken out on this home.
Original Mortgage
$258,000
Outstanding Balance
$130,518
Interest Rate
5.78%
Mortgage Type
Purchase Money Mortgage
Estimated Equity
$371,650
Purchase Details
Closed on
Jul 1, 1998
Sold by
Linyard Richard and Linyard Maggie
Bought by
Lee David T and Lee Jennifer A
Home Financials for this Owner
Home Financials are based on the most recent Mortgage that was taken out on this home.
Original Mortgage
$78,000
Interest Rate
7.17%
Purchase Details
Closed on
Feb 12, 1996
Sold by
Standard Bk & Tr Company Of Hickory Hills
Bought by
Linyard Richard and Linyard Maggie
Home Financials for this Owner
Home Financials are based on the most recent Mortgage that was taken out on this home.
Original Mortgage
$150,000
Interest Rate
6.98%
Create a Home Valuation Report for This Property
The Home Valuation Report is an in-depth analysis detailing your home's value as well as a comparison with similar homes in the area
Home Values in the Area
Average Home Value in this Area
Purchase History
| Date | Buyer | Sale Price | Title Company |
|---|---|---|---|
| Abuata Mohd | $322,500 | Chicago Title Insurance Comp | |
| Lee David T | $258,000 | Chicago Title Insurance Co | |
| Linyard Richard | $266,000 | 1St American Title |
Source: Public Records
Mortgage History
| Date | Status | Borrower | Loan Amount |
|---|---|---|---|
| Open | Abuata Mohd | $258,000 | |
| Previous Owner | Lee David T | $78,000 | |
| Previous Owner | Linyard Richard | $150,000 | |
| Closed | Linyard Richard | $60,000 |
Source: Public Records
Tax History Compared to Growth
Tax History
| Year | Tax Paid | Tax Assessment Tax Assessment Total Assessment is a certain percentage of the fair market value that is determined by local assessors to be the total taxable value of land and additions on the property. | Land | Improvement |
|---|---|---|---|---|
| 2024 | $11,360 | $157,748 | $30,263 | $127,485 |
| 2023 | $11,360 | $140,884 | $27,028 | $113,856 |
| 2022 | $9,941 | $128,321 | $24,618 | $103,703 |
| 2021 | $9,364 | $120,049 | $23,031 | $97,018 |
| 2020 | $9,174 | $134,766 | $22,382 | $112,384 |
| 2019 | $10,348 | $131,159 | $21,783 | $109,376 |
| 2018 | $10,010 | $127,389 | $21,157 | $106,232 |
| 2017 | $9,831 | $124,415 | $20,663 | $103,752 |
| 2016 | $9,563 | $120,150 | $19,955 | $100,195 |
| 2015 | $9,109 | $115,919 | $19,252 | $96,667 |
| 2014 | $9,109 | $115,113 | $19,118 | $95,995 |
| 2013 | $9,109 | $116,606 | $19,366 | $97,240 |
Source: Public Records
Map
Nearby Homes
- 19443 Trenton Way
- 19425 Everett Ln
- 9860 Stafford Ct
- 10119 Cambridge Dr
- 19242 104th Ave
- 10015 Cambridge Dr
- 19525 Fiona Ave
- 19222 104th Ave
- 9702 Chelsea Place
- 10531 Thornham Ln Unit 10531
- 19300 S La Grange Rd
- 20014 Everett Ln
- Lots 4,5, & 6 191st St
- Vacant 191st St
- 19060 Everett Blvd
- 10508 W La Porte Rd
- 18821 Dickens Dr
- 10752 First Ct
- 19725 S Schoolhouse Rd
- 19099 Hickory Creek Dr
- 19452 Stonehenge Dr
- 19457 Trenton Way
- 19500 Stonehenge Dr
- 19451 Trenton Way
- 19444 Stonehenge Dr Unit 3A
- 19457 Stonehenge Dr
- 19501 Trenton Way
- 19451 Stonehenge Dr
- 19518 Stonehenge Dr
- 19501 Stonehenge Dr
- 19443 Stonehenge Dr
- 19434 Stonehenge Dr
- 19509 Trenton Way
- 19433 Trenton Way
- 19433 Trenton Way
- 19517 Stonehenge Dr
- 19458 Trenton Way
- 19452 Trenton Way Unit 3A
- 19426 Stonehenge Dr
- 19517 Trenton Way