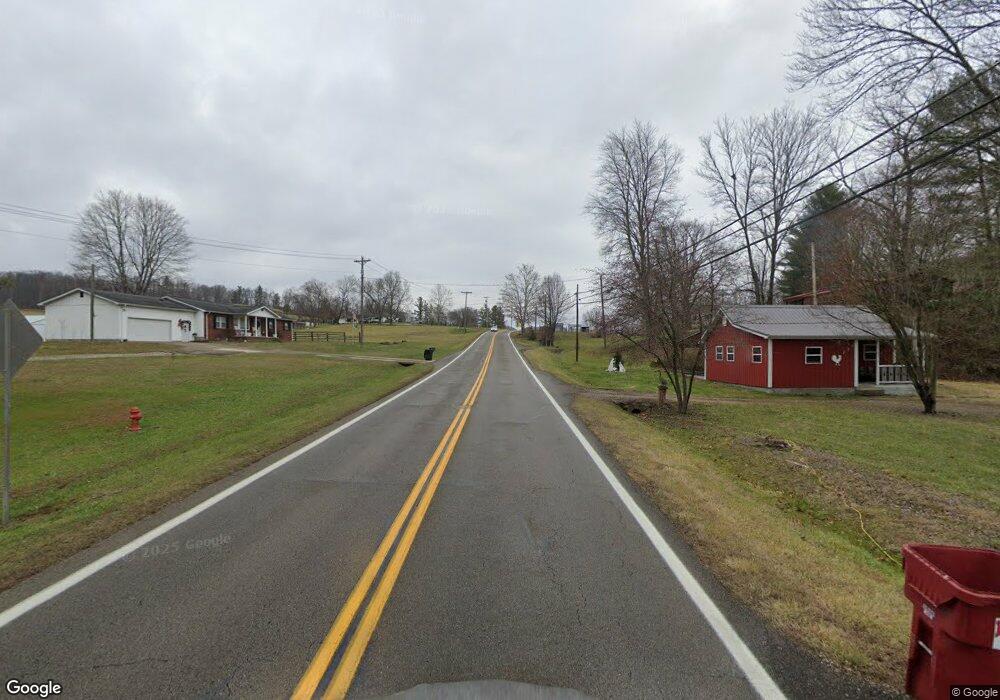
19465 State Route 93 Wellston, OH 45692
Estimated Value: $60,000 - $70,717
2
Beds
--
Bath
624
Sq Ft
$107/Sq Ft
Est. Value
About This Home
This home is located at 19465 State Route 93, Wellston, OH 45692 and is currently estimated at $66,679, approximately $106 per square foot. 19465 State Route 93 is a home located in Jackson County with nearby schools including Bundy Elementary School, Wellston Intermediate School, and Wellston Middle School.
Ownership History
Date
Name
Owned For
Owner Type
Purchase Details
Closed on
Oct 8, 2024
Sold by
Duncan Ronald K
Bought by
Adkins Jeffrey W
Current Estimated Value
Purchase Details
Closed on
Aug 31, 2012
Sold by
Duncan Ronald K
Bought by
Duncan Ronald K
Purchase Details
Closed on
Dec 1, 2010
Sold by
Stanley Thomas
Bought by
Duncan Ronald K
Purchase Details
Closed on
May 17, 2007
Sold by
Curry Max
Bought by
Stanley Thomas
Home Financials for this Owner
Home Financials are based on the most recent Mortgage that was taken out on this home.
Original Mortgage
$28,500
Interest Rate
6.37%
Mortgage Type
New Conventional
Purchase Details
Closed on
Feb 22, 2007
Sold by
Tinsley Chales M
Bought by
Curry Max
Purchase Details
Closed on
Mar 3, 2005
Sold by
Tinsley Charles M
Bought by
Tinsley Charles M
Purchase Details
Closed on
Oct 15, 1999
Sold by
Boyd Esther L
Bought by
Tinsley Charles M
Purchase Details
Closed on
Oct 30, 1998
Sold by
Boyd Odis E
Bought by
Boyd Esther L
Create a Home Valuation Report for This Property
The Home Valuation Report is an in-depth analysis detailing your home's value as well as a comparison with similar homes in the area
Purchase History
| Date | Buyer | Sale Price | Title Company |
|---|---|---|---|
| Adkins Jeffrey W | $65,000 | Northwest Title | |
| Adkins Jeffrey W | $65,000 | Northwest Title | |
| Duncan Ronald K | -- | None Available | |
| Duncan Ronald K | $25,000 | Attorney | |
| Stanley Thomas | $28,500 | Zachs Title Co | |
| Curry Max | $6,650 | Attorney | |
| Tinsley Charles M | -- | Attorney | |
| Tinsley Charles M | -- | Attorney | |
| Tinsley Charles M | $10,000 | -- | |
| Boyd Esther L | -- | -- |
Source: Public Records
Mortgage History
| Date | Status | Borrower | Loan Amount |
|---|---|---|---|
| Previous Owner | Stanley Thomas | $28,500 |
Source: Public Records
Tax History
| Year | Tax Paid | Tax Assessment Tax Assessment Total Assessment is a certain percentage of the fair market value that is determined by local assessors to be the total taxable value of land and additions on the property. | Land | Improvement |
|---|---|---|---|---|
| 2025 | $526 | $16,910 | $5,600 | $11,310 |
| 2024 | $4,442 | $16,910 | $5,600 | $11,310 |
| 2023 | $3,674 | $16,910 | $5,600 | $11,310 |
| 2022 | $499 | $13,060 | $4,470 | $8,590 |
| 2021 | $422 | $13,060 | $4,470 | $8,590 |
| 2020 | $435 | $13,060 | $4,470 | $8,590 |
| 2019 | $390 | $11,360 | $3,890 | $7,470 |
| 2018 | $376 | $11,360 | $3,890 | $7,470 |
| 2017 | $355 | $11,360 | $3,890 | $7,470 |
| 2016 | $1,865 | $9,190 | $4,550 | $4,640 |
| 2015 | $287 | $9,190 | $4,550 | $4,640 |
| 2013 | $279 | $8,920 | $4,550 | $4,370 |
| 2012 | $466 | $8,920 | $4,550 | $4,370 |
Source: Public Records
Map
Nearby Homes
- 304 Prices Switch Rd
- 54 2nd St
- 45 2nd St
- 0 Broadway St
- 170 Taft St
- 40 Jackson Hill Rd
- 88 Taft St
- 17 Cambrian Ave
- 601 Fairgreens Rd
- 603 Fairgreens Rd
- 82 Main St
- 759 Fairgreens Rd
- 234 Mill St
- 44 E Vine St
- 5 W Coffman St
- 1449 Hard Scrapple Rd
- 1497 Hard Scrapple Rd
- 387 E Broadway St
- 273 Harding Ave
- 281 Pattonsville Rd
- 19445 State Route 93
- 19490 State Route 93
- 19460 Ohio 93
- 19545 State Route 93
- 19347 State Route 93
- 2614 Jackson Hill Rd
- 19586 State Route 93
- 2574 Jackson Hill Rd
- 19456 State Route 93
- 2593 Jackson Hill Rd
- 2546 Jackson Hill Rd
- 19464 State Route 93
- 19458 State Route 93
- 2526 Jackson Hill Rd
- 2563 Jackson Hill Rd
- 2461 Jackson Hill Rd
- 2369 Jackson Hill Rd
- 19715 State Route 93
- 19706 State Route 93
- 2454 Jackson Hill Rd
Your Personal Tour Guide
Ask me questions while you tour the home.