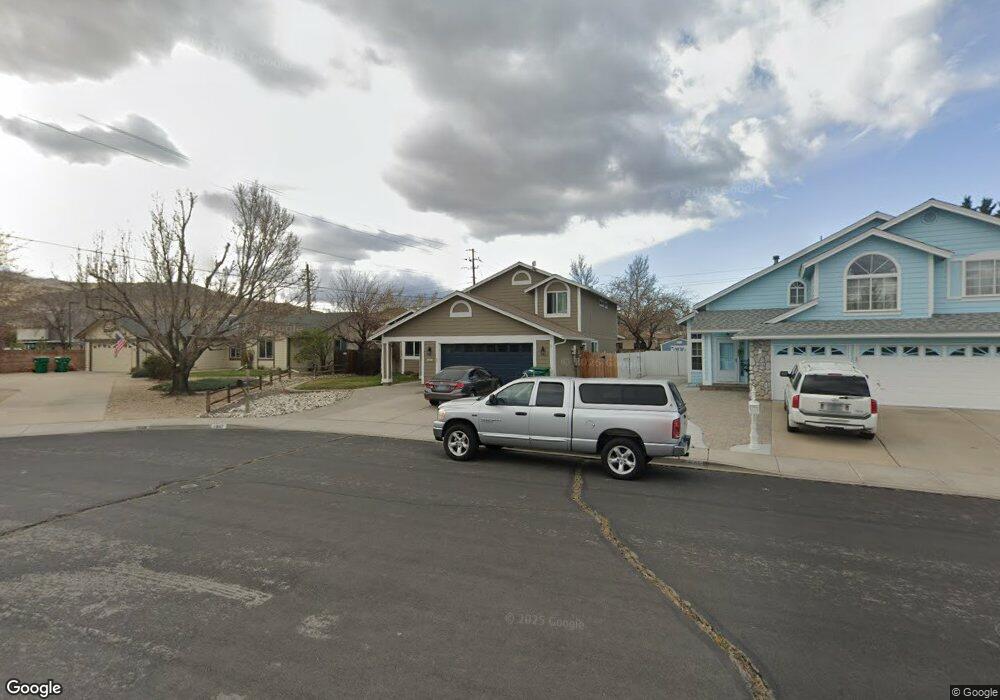
1947 Engineer Ct Sparks, NV 89434
Reed NeighborhoodEstimated Value: $524,236 - $604,000
4
Beds
3
Baths
2,152
Sq Ft
$262/Sq Ft
Est. Value
About This Home
This home is located at 1947 Engineer Ct, Sparks, NV 89434 and is currently estimated at $563,809, approximately $261 per square foot. 1947 Engineer Ct is a home located in Washoe County with nearby schools including Lloyd Diedrichsen Elementary School, Lou Mendive Middle School, and Edward C Reed High School.
Ownership History
Date
Name
Owned For
Owner Type
Purchase Details
Closed on
Mar 24, 1998
Sold by
International Trust Administrators
Bought by
Mccubbins Charles J and Mccubbins Kimberley S
Current Estimated Value
Home Financials for this Owner
Home Financials are based on the most recent Mortgage that was taken out on this home.
Original Mortgage
$181,560
Outstanding Balance
$33,332
Interest Rate
7.06%
Mortgage Type
VA
Estimated Equity
$530,477
Purchase Details
Closed on
May 20, 1996
Sold by
Sydenham Steve and Sydenham Debbie
Bought by
Raymond Robert R and Bernhoft Robert G
Purchase Details
Closed on
Dec 12, 1994
Sold by
Bailey and Bailey Mcgah
Bought by
Sydenham Steve and Sydenham Debra
Home Financials for this Owner
Home Financials are based on the most recent Mortgage that was taken out on this home.
Original Mortgage
$120,000
Interest Rate
5.5%
Create a Home Valuation Report for This Property
The Home Valuation Report is an in-depth analysis detailing your home's value as well as a comparison with similar homes in the area
Home Values in the Area
Average Home Value in this Area
Purchase History
| Date | Buyer | Sale Price | Title Company |
|---|---|---|---|
| Mccubbins Charles J | $178,000 | First American Title Co | |
| Raymond Robert R | -- | -- | |
| Sydenham Steve | $164,000 | Stewart Title |
Source: Public Records
Mortgage History
| Date | Status | Borrower | Loan Amount |
|---|---|---|---|
| Open | Mccubbins Charles J | $181,560 | |
| Previous Owner | Sydenham Steve | $120,000 |
Source: Public Records
Tax History Compared to Growth
Tax History
| Year | Tax Paid | Tax Assessment Tax Assessment Total Assessment is a certain percentage of the fair market value that is determined by local assessors to be the total taxable value of land and additions on the property. | Land | Improvement |
|---|---|---|---|---|
| 2025 | $2,683 | $96,487 | $32,508 | $63,979 |
| 2024 | $2,683 | $94,583 | $29,894 | $64,690 |
| 2023 | $2,606 | $93,225 | $31,658 | $61,568 |
| 2022 | $2,530 | $75,616 | $24,066 | $51,550 |
| 2021 | $2,457 | $71,060 | $19,562 | $51,498 |
| 2020 | $2,385 | $70,468 | $18,648 | $51,820 |
| 2019 | $2,315 | $69,021 | $18,648 | $50,373 |
| 2018 | $2,248 | $62,443 | $13,010 | $49,433 |
| 2017 | $2,183 | $62,121 | $12,348 | $49,773 |
| 2016 | $2,127 | $61,783 | $11,025 | $50,758 |
| 2015 | $2,125 | $60,539 | $9,293 | $51,246 |
| 2014 | $2,063 | $57,321 | $8,127 | $49,194 |
| 2013 | -- | $55,142 | $6,517 | $48,625 |
Source: Public Records
Map
Nearby Homes
- 2002 Wabash Cir
- 1752 Wabash Cir
- 2024 Woodtrail Dr
- 1860 Medolla Dr
- 2335 Calabria Dr
- 1851 Cosenza Dr
- 2119 Avella Dr
- 1713 Candlewood St
- 2372 Napoli Dr
- 2479 Napoli Dr
- 1332 Coachman Ct
- 2267 Ticino Ct
- 1821 Fargo Way
- 1273 Junction Dr
- 2594 San Remo Dr
- 2763 Blossom View Dr
- 1687 Noreen Dr
- 2641 Venezia Dr
- 2585 Anqua Dr
- 2688 Laguna Way
- 1945 Engineer Ct
- 1949 Engineer Ct
- 1943 Engineer Ct
- 1951 Engineer Ct
- 1955 E Prater Way
- 1944 Engineer Ct
- 1941 Engineer Ct
- 1948 Engineer Ct
- 1950 Engineer Ct
- 1939 Engineer Ct
- 1936 Engineer Ct
- 1937 Engineer Ct
- 1957 Railway Ct
- 1934 Engineer Ct
- 1935 Engineer Ct
- 1955 Railway Ct
- 1959 Railway Ct
- 1953 Railway Ct
- 1942 Wabash Cir
- 1958 Railway Ct