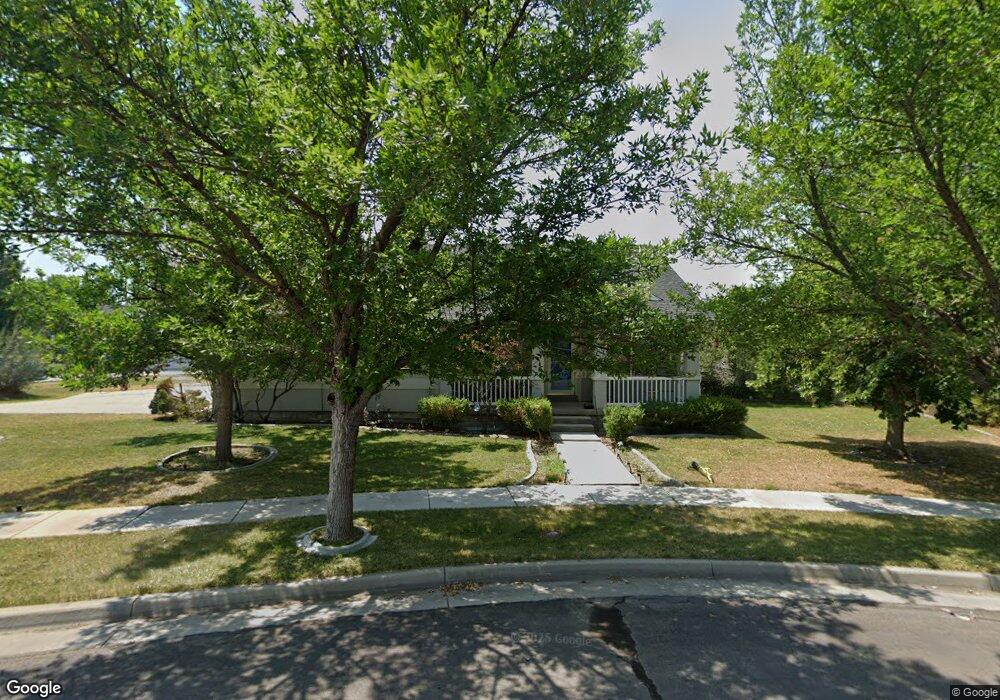
1947 N 270 W Tooele, UT 84074
Estimated Value: $449,000 - $474,953
3
Beds
2
Baths
2,942
Sq Ft
$157/Sq Ft
Est. Value
About This Home
This home is located at 1947 N 270 W, Tooele, UT 84074 and is currently estimated at $461,988, approximately $157 per square foot. 1947 N 270 W is a home located in Tooele County with nearby schools including Overlake Elementary School, Clarke N. Johnsen Junior High School, and Stansbury High School.
Ownership History
Date
Name
Owned For
Owner Type
Purchase Details
Closed on
Feb 5, 2022
Sold by
Flores Timothy J and Flores Danielle
Bought by
Flores Timothy J
Current Estimated Value
Home Financials for this Owner
Home Financials are based on the most recent Mortgage that was taken out on this home.
Original Mortgage
$303,548
Outstanding Balance
$281,901
Interest Rate
3.56%
Mortgage Type
VA
Estimated Equity
$180,087
Purchase Details
Closed on
Jul 20, 2011
Sold by
Reynolds Shari S
Bought by
Flores Timothy J
Home Financials for this Owner
Home Financials are based on the most recent Mortgage that was taken out on this home.
Original Mortgage
$165,280
Interest Rate
4.45%
Mortgage Type
VA
Purchase Details
Closed on
Jul 18, 2011
Sold by
Flores Timothy J
Bought by
Flores Timothy J and Flores Danielle
Home Financials for this Owner
Home Financials are based on the most recent Mortgage that was taken out on this home.
Original Mortgage
$165,280
Interest Rate
4.45%
Mortgage Type
VA
Create a Home Valuation Report for This Property
The Home Valuation Report is an in-depth analysis detailing your home's value as well as a comparison with similar homes in the area
Home Values in the Area
Average Home Value in this Area
Purchase History
| Date | Buyer | Sale Price | Title Company |
|---|---|---|---|
| Flores Timothy J | -- | None Listed On Document | |
| Flores Timothy J | -- | Metro National Title | |
| Flores Timothy J | -- | Titan Title Insurance Agency |
Source: Public Records
Mortgage History
| Date | Status | Borrower | Loan Amount |
|---|---|---|---|
| Open | Flores Timothy J | $303,548 | |
| Previous Owner | Flores Timothy J | $165,280 |
Source: Public Records
Tax History Compared to Growth
Tax History
| Year | Tax Paid | Tax Assessment Tax Assessment Total Assessment is a certain percentage of the fair market value that is determined by local assessors to be the total taxable value of land and additions on the property. | Land | Improvement |
|---|---|---|---|---|
| 2025 | $3,015 | $441,791 | $122,500 | $319,291 |
| 2024 | $3,202 | $236,777 | $67,375 | $169,402 |
| 2023 | $3,202 | $237,793 | $64,140 | $173,653 |
| 2022 | $2,970 | $245,431 | $75,515 | $169,916 |
| 2021 | $2,700 | $185,488 | $26,331 | $159,157 |
| 2020 | $2,531 | $306,246 | $47,875 | $258,371 |
| 2019 | $2,361 | $282,758 | $47,875 | $234,883 |
| 2018 | $2,054 | $234,053 | $35,000 | $199,053 |
| 2017 | $1,602 | $215,957 | $35,000 | $180,957 |
| 2016 | $1,380 | $102,855 | $11,000 | $91,855 |
| 2015 | $1,380 | $97,877 | $0 | $0 |
| 2014 | -- | $97,877 | $0 | $0 |
Source: Public Records
Map
Nearby Homes
- 1969 N 270 W
- 535 W 2030 N Unit 23
- 1913 N 370 W
- 2117 N 170 W
- 437 W 1910 N Unit 317
- 81 W 1930 N
- 1909 N 70 W
- 1893 N 70 W
- 1893 N 70 W Unit 620
- 1877 N 70 W Unit 618
- 1885 N 70 W Unit 619
- 2155 N 170 W
- 1861 N 70 W Unit 616
- 69 1930 N
- 2098 N 425 W Unit 240
- 2098 N 425 W
- Franklin Plan at Compass Point
- Ash Plan at Compass Point
- Kennedy Plan at Compass Point
- McKinley Plan at Compass Point
- 1921 N 270 W
- 1961 N 270 W
- 1946 Clemens Way
- 1928 Clemens Way
- 1944 N 270 W
- 1962 Clemens Way
- 1922 N 270 W
- 256 W 1960 N
- 240 W 1960 N
- 1982 Clemens Way
- 1887 N 270 W
- 235 E Ventura Blvd Unit 124
- 1892 Clemens Way
- 1945 N 210 W
- 1945 N 210 W Unit 153
- 1929 N 210 W
- 1888 N 270 W
- 228 W 1960 N
- 331 W 1950 N
- 1875 N 270 W