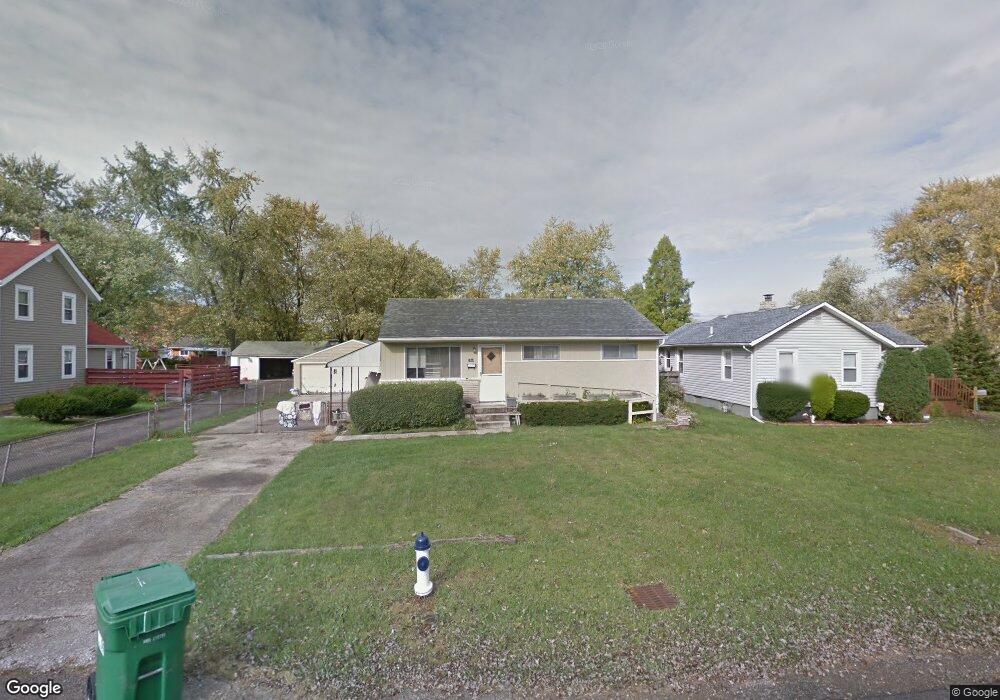
1948 Case Rd Columbus, OH 43224
North Linden NeighborhoodEstimated Value: $172,000 - $222,000
3
Beds
1
Bath
936
Sq Ft
$206/Sq Ft
Est. Value
About This Home
This home is located at 1948 Case Rd, Columbus, OH 43224 and is currently estimated at $192,642, approximately $205 per square foot. 1948 Case Rd is a home located in Franklin County with nearby schools including North Linden Elementary School, Medina Middle School, and Mifflin High School.
Ownership History
Date
Name
Owned For
Owner Type
Purchase Details
Closed on
Sep 21, 2020
Sold by
Banks Angela Lynn and Banks Mason Angela
Bought by
Mason Victor R and Banks Mason Angela
Current Estimated Value
Home Financials for this Owner
Home Financials are based on the most recent Mortgage that was taken out on this home.
Original Mortgage
$64,875
Outstanding Balance
$57,047
Interest Rate
2.9%
Mortgage Type
New Conventional
Estimated Equity
$135,595
Purchase Details
Closed on
Jun 29, 2005
Sold by
Cummings William R and Cummings Mary E
Bought by
Banks Angela Lynn
Home Financials for this Owner
Home Financials are based on the most recent Mortgage that was taken out on this home.
Original Mortgage
$82,200
Interest Rate
5.69%
Mortgage Type
Fannie Mae Freddie Mac
Purchase Details
Closed on
Sep 24, 2001
Sold by
Cummings William R
Bought by
Cummings William R and Cummings Mary Ella
Purchase Details
Closed on
Aug 26, 1986
Bought by
Cummings William R
Create a Home Valuation Report for This Property
The Home Valuation Report is an in-depth analysis detailing your home's value as well as a comparison with similar homes in the area
Home Values in the Area
Average Home Value in this Area
Purchase History
| Date | Buyer | Sale Price | Title Company |
|---|---|---|---|
| Mason Victor R | -- | Mortgage Connect Lp | |
| Banks Angela Lynn | $84,800 | Stewart Tit | |
| Cummings William R | -- | -- | |
| Cummings William R | $44,000 | -- |
Source: Public Records
Mortgage History
| Date | Status | Borrower | Loan Amount |
|---|---|---|---|
| Open | Mason Victor R | $64,875 | |
| Closed | Banks Angela Lynn | $82,200 |
Source: Public Records
Tax History
| Year | Tax Paid | Tax Assessment Tax Assessment Total Assessment is a certain percentage of the fair market value that is determined by local assessors to be the total taxable value of land and additions on the property. | Land | Improvement |
|---|---|---|---|---|
| 2025 | $2,976 | $51,530 | $11,520 | $40,010 |
| 2024 | $2,976 | $51,530 | $11,520 | $40,010 |
| 2023 | $2,944 | $51,520 | $11,515 | $40,005 |
| 2022 | $1,864 | $25,590 | $7,490 | $18,100 |
| 2021 | $1,866 | $25,590 | $7,490 | $18,100 |
| 2020 | $1,869 | $25,590 | $7,490 | $18,100 |
| 2019 | $1,605 | $20,340 | $6,020 | $14,320 |
| 2018 | $1,675 | $20,340 | $6,020 | $14,320 |
| 2017 | $1,603 | $20,340 | $6,020 | $14,320 |
| 2016 | $2,002 | $22,960 | $4,620 | $18,340 |
| 2015 | $1,747 | $22,960 | $4,620 | $18,340 |
| 2014 | $1,750 | $22,960 | $4,620 | $18,340 |
| 2013 | $955 | $25,515 | $5,145 | $20,370 |
Source: Public Records
Map
Nearby Homes
- 1997 Ferris Rd
- 2023 Ferris Rd
- 2045 Sale Rd
- 1874 Sale Rd
- 1863 Ward Rd
- 2100 Ferris Rd
- 2081 Ormond Ave
- 1946 Lehner Rd
- 2010 Melrose Ave
- 3750 Dresden St
- 2267 Ferris Rd
- 2283 Ward Rd
- 1637 Sale Rd
- 2299 Belcher Dr
- 4090 Cleveland Ave
- 2298 Belcher Dr
- 3583 Dresden St
- 3508 Kenlawn St
- 3967 Karl Rd Unit 224
- 3939 Karl Rd Unit 311
Your Personal Tour Guide
Ask me questions while you tour the home.