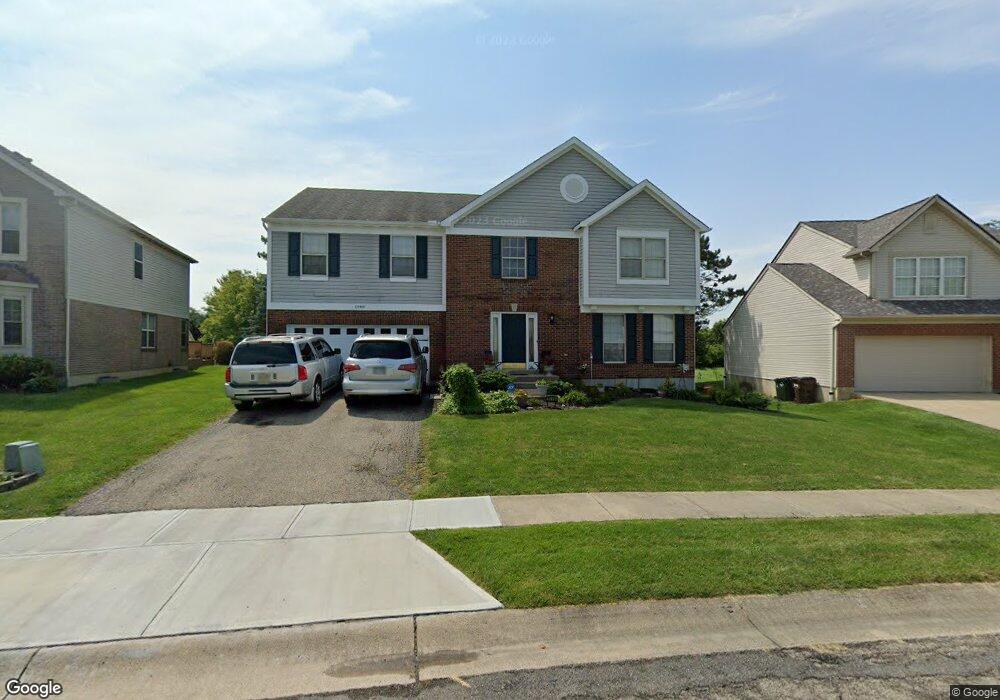
1948 Crest Rd Cincinnati, OH 45240
Estimated Value: $411,377 - $453,000
4
Beds
3
Baths
2,833
Sq Ft
$154/Sq Ft
Est. Value
About This Home
This home is located at 1948 Crest Rd, Cincinnati, OH 45240 and is currently estimated at $435,844, approximately $153 per square foot. 1948 Crest Rd is a home located in Hamilton County with nearby schools including Pleasant Run Elementary School, Pleasant Run Middle School, and Northwest High School.
Ownership History
Date
Name
Owned For
Owner Type
Purchase Details
Closed on
Mar 28, 2003
Sold by
Brown Byron D and Brown Tracy L
Bought by
Jasper James and Jasper Tracey
Current Estimated Value
Home Financials for this Owner
Home Financials are based on the most recent Mortgage that was taken out on this home.
Original Mortgage
$170,000
Outstanding Balance
$70,497
Interest Rate
5.76%
Estimated Equity
$365,347
Purchase Details
Closed on
Apr 14, 1994
Sold by
Zaring Homes Inc
Bought by
Brown Byron D and Brown Tracy L
Home Financials for this Owner
Home Financials are based on the most recent Mortgage that was taken out on this home.
Original Mortgage
$149,500
Interest Rate
7.51%
Create a Home Valuation Report for This Property
The Home Valuation Report is an in-depth analysis detailing your home's value as well as a comparison with similar homes in the area
Home Values in the Area
Average Home Value in this Area
Purchase History
| Date | Buyer | Sale Price | Title Company |
|---|---|---|---|
| Jasper James | $212,500 | -- | |
| Brown Byron D | -- | -- |
Source: Public Records
Mortgage History
| Date | Status | Borrower | Loan Amount |
|---|---|---|---|
| Open | Jasper James | $170,000 | |
| Previous Owner | Brown Byron D | $149,500 |
Source: Public Records
Tax History
| Year | Tax Paid | Tax Assessment Tax Assessment Total Assessment is a certain percentage of the fair market value that is determined by local assessors to be the total taxable value of land and additions on the property. | Land | Improvement |
|---|---|---|---|---|
| 2025 | $5,549 | $106,029 | $15,400 | $90,629 |
| 2023 | $5,449 | $106,029 | $15,400 | $90,629 |
| 2022 | $4,908 | $77,679 | $13,188 | $64,491 |
| 2021 | $4,868 | $77,679 | $13,188 | $64,491 |
| 2020 | $4,916 | $77,679 | $13,188 | $64,491 |
| 2019 | $4,587 | $64,733 | $10,990 | $53,743 |
| 2018 | $4,114 | $64,733 | $10,990 | $53,743 |
| 2017 | $3,900 | $64,733 | $10,990 | $53,743 |
| 2016 | $3,636 | $59,245 | $11,781 | $47,464 |
| 2015 | $3,669 | $59,245 | $11,781 | $47,464 |
| 2014 | $3,335 | $59,245 | $11,781 | $47,464 |
| 2013 | $3,231 | $58,083 | $11,550 | $46,533 |
Source: Public Records
Map
Nearby Homes
- 2017 Broadhurst Ave
- 1944 Creswell Dr
- 11717 Hamilton Ave
- 2465 Owlcrest Dr
- 2171 Rangoon Ct
- 11484 Ravensburg Ct
- 12080 Regency Run Ct Unit 4
- 11835 Wincanton Dr
- 11995 Wincanton Dr
- 11777 Cedarcreek Dr
- 12120 Regency Run Ct
- 11586 Pippin Rd
- 1959 John Gray Rd
- 11911 Pippin Rd
- 11992 Pippin Rd
- 11955 Mill Rd
- 1759 John Gray Rd
- 1632 Forester Dr
- 12161 Birchgrove Ct
- 11505 Oxfordshire Ln
Your Personal Tour Guide
Ask me questions while you tour the home.