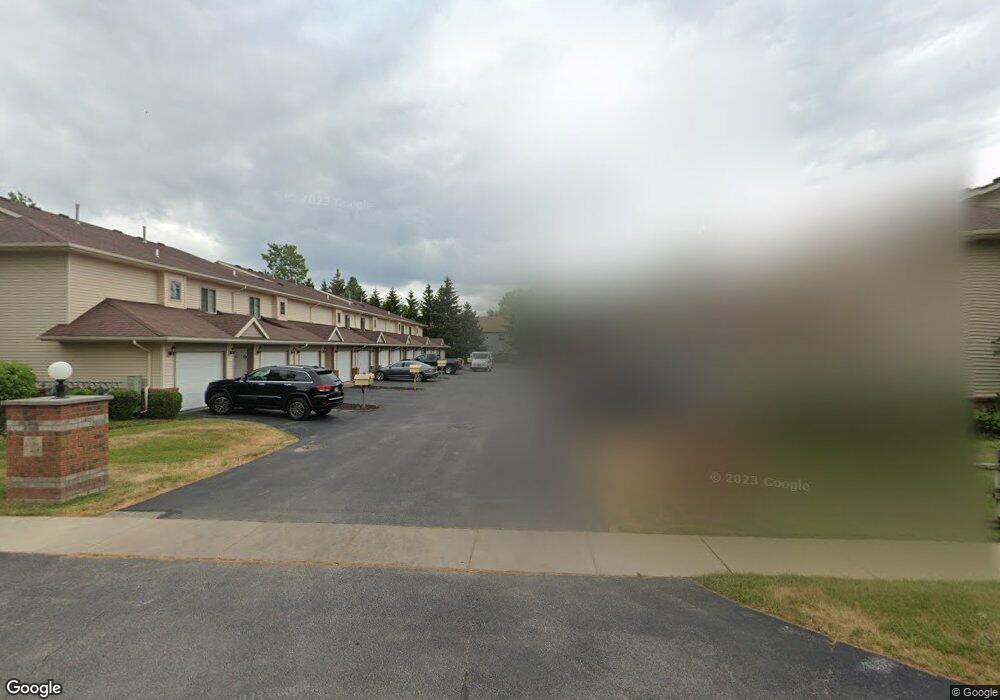
1948 Devinci Dr Unit A103 Toledo, OH 43615
Reynolds Corners NeighborhoodEstimated Value: $149,000 - $173,000
2
Beds
2
Baths
1,050
Sq Ft
$155/Sq Ft
Est. Value
About This Home
This home is located at 1948 Devinci Dr Unit A103, Toledo, OH 43615 and is currently estimated at $162,507, approximately $154 per square foot. 1948 Devinci Dr Unit A103 is a home located in Lucas County with nearby schools including Hawkins Elementary School, Rogers High School, and St. Benedict Catholic School.
Ownership History
Date
Name
Owned For
Owner Type
Purchase Details
Closed on
Sep 15, 2010
Sold by
Fannie Mae
Bought by
Saunders Patricia
Current Estimated Value
Home Financials for this Owner
Home Financials are based on the most recent Mortgage that was taken out on this home.
Original Mortgage
$68,400
Outstanding Balance
$44,574
Interest Rate
4.26%
Mortgage Type
New Conventional
Estimated Equity
$117,933
Purchase Details
Closed on
Apr 29, 2010
Sold by
Sallee Andrea N
Bought by
Federal National Mortgage Association
Purchase Details
Closed on
Dec 13, 2005
Sold by
Persis Development Llc
Bought by
Sallee Andrea N
Home Financials for this Owner
Home Financials are based on the most recent Mortgage that was taken out on this home.
Original Mortgage
$103,177
Interest Rate
6.36%
Mortgage Type
Fannie Mae Freddie Mac
Create a Home Valuation Report for This Property
The Home Valuation Report is an in-depth analysis detailing your home's value as well as a comparison with similar homes in the area
Home Values in the Area
Average Home Value in this Area
Purchase History
| Date | Buyer | Sale Price | Title Company |
|---|---|---|---|
| Saunders Patricia | $72,000 | Thoroughbred Title | |
| Federal National Mortgage Association | $56,667 | Attorney | |
| Sallee Andrea N | $129,000 | Liberty Title & Escrow Inc |
Source: Public Records
Mortgage History
| Date | Status | Borrower | Loan Amount |
|---|---|---|---|
| Open | Saunders Patricia | $68,400 | |
| Previous Owner | Sallee Andrea N | $103,177 |
Source: Public Records
Tax History Compared to Growth
Tax History
| Year | Tax Paid | Tax Assessment Tax Assessment Total Assessment is a certain percentage of the fair market value that is determined by local assessors to be the total taxable value of land and additions on the property. | Land | Improvement |
|---|---|---|---|---|
| 2024 | $710 | $33,005 | $4,515 | $28,490 |
| 2023 | $1,522 | $33,215 | $4,550 | $28,665 |
| 2022 | $1,541 | $33,215 | $4,550 | $28,665 |
| 2021 | $1,591 | $33,215 | $4,550 | $28,665 |
| 2020 | $103 | $3,850 | $3,850 | $0 |
| 2019 | $93 | $3,850 | $3,850 | $0 |
| 2018 | $101 | $3,850 | $3,850 | $0 |
| 2017 | $79 | $3,745 | $3,745 | $0 |
| 2016 | $93 | $10,700 | $10,700 | $0 |
| 2015 | $106 | $10,700 | $10,700 | $0 |
| 2014 | -- | $3,750 | $3,750 | $0 |
| 2013 | -- | $3,750 | $3,750 | $0 |
Source: Public Records
Map
Nearby Homes
- 1966 Devinci Dr
- 1911 N Holland Sylvania Rd
- 2004 Oakside Rd
- 2015 Oakside Rd
- 2010 Oakside Rd
- 1930 Birkdale Rd
- 1916 Birkdale Rd
- 5665 Camberley Dr
- 1709 Acorn Dr
- 2113 Broadstone Rd
- 1925 Olimphia Rd
- 1715 Brooklynn Park W
- 405 N Holland Sylvania Rd
- 5743 Candlestick Ct E
- 5331 Fleet Rd
- 4860 Airport Hwy
- 2523 Briarwood Ln
- 1101 Sawyer Rd
- 1032 Saturn Dr
- 2537 Vaness Dr
- 1948 Devinci Dr Unit A-10
- 1952 Devinci Dr Unit A102
- 1958 Devinci Dr
- 1954 Devinci Dr Unit A202
- 1942 Devinci Dr Unit A104
- 1956 Devinci Dr Unit A101
- 1938 Devinci Dr Unit A105
- 1936 Devinci Dr Unit A206
- 1940 Devinci Dr Unit 1A205
- 1940 Devinci Dr Unit A205
- 1934 Devinci Dr Unit A106
- 0 Devinci Dr Unit 5028202
- 0 Devinci Dr Unit 5028216
- 1932 N Holland Sylvania Rd
- 1964 Devinci Dr Unit B101
- 1978 Devinci Dr
- 1974 Devinci Dr
- 1972 Devinci Dr
- 1968 Devinci Dr
- 1944 Devinci Dr Unit A204