1948 Las Palmas Ln Unit 278 Laughlin, NV 89029
Estimated Value: $147,485 - $183,000
2
Beds
2
Baths
1,023
Sq Ft
$161/Sq Ft
Est. Value
About This Home
This home is located at 1948 Las Palmas Ln Unit 278, Laughlin, NV 89029 and is currently estimated at $164,621, approximately $160 per square foot. 1948 Las Palmas Ln Unit 278 is a home located in Clark County with nearby schools including William G. Bennett Elementary School and Laughlin Junior/Senior High School.
Ownership History
Date
Name
Owned For
Owner Type
Purchase Details
Closed on
Oct 4, 2010
Sold by
Stevenson Thomas J
Bought by
Stevenson Thomas J and Thomas J Stevenson Revocable Trust
Current Estimated Value
Purchase Details
Closed on
Oct 25, 2004
Sold by
Rust Howard L and Rust Charlene A
Bought by
Stevenson Thomas J
Home Financials for this Owner
Home Financials are based on the most recent Mortgage that was taken out on this home.
Original Mortgage
$16,000
Outstanding Balance
$7,953
Interest Rate
5.72%
Mortgage Type
Credit Line Revolving
Estimated Equity
$156,668
Purchase Details
Closed on
Sep 26, 2000
Sold by
Street Eileen R and Rood Robert A
Bought by
Rust Howard L and Rust Charlene A
Purchase Details
Closed on
Dec 15, 1999
Sold by
Gibbs R Nathan
Bought by
Street Eileen R and Rood Robert A
Purchase Details
Closed on
Dec 23, 1996
Sold by
Law Offices Of Steven J Melmet
Bought by
Federal National Mortgage Association
Create a Home Valuation Report for This Property
The Home Valuation Report is an in-depth analysis detailing your home's value as well as a comparison with similar homes in the area
Home Values in the Area
Average Home Value in this Area
Purchase History
| Date | Buyer | Sale Price | Title Company |
|---|---|---|---|
| Stevenson Thomas J | -- | None Available | |
| Stevenson Thomas J | $126,000 | Southwest Title | |
| Rust Howard L | $65,000 | Nevada Title Company | |
| Street Eileen R | -- | -- | |
| Federal National Mortgage Association | $70,300 | Nevada Title Company |
Source: Public Records
Mortgage History
| Date | Status | Borrower | Loan Amount |
|---|---|---|---|
| Open | Stevenson Thomas J | $16,000 |
Source: Public Records
Tax History Compared to Growth
Tax History
| Year | Tax Paid | Tax Assessment Tax Assessment Total Assessment is a certain percentage of the fair market value that is determined by local assessors to be the total taxable value of land and additions on the property. | Land | Improvement |
|---|---|---|---|---|
| 2025 | $982 | $28,366 | $8,750 | $19,616 |
| 2024 | $987 | $28,366 | $8,750 | $19,616 |
| 2023 | $656 | $32,394 | $14,000 | $18,394 |
| 2022 | $914 | $30,802 | $13,650 | $17,152 |
| 2021 | $846 | $27,261 | $10,500 | $16,761 |
| 2020 | $784 | $26,573 | $9,800 | $16,773 |
| 2019 | $735 | $23,819 | $7,000 | $16,819 |
| 2018 | $701 | $22,471 | $5,950 | $16,521 |
| 2017 | $746 | $22,278 | $5,250 | $17,028 |
| 2016 | $656 | $22,042 | $5,250 | $16,792 |
| 2015 | $654 | $20,545 | $5,250 | $15,295 |
| 2014 | $635 | $18,422 | $5,250 | $13,172 |
Source: Public Records
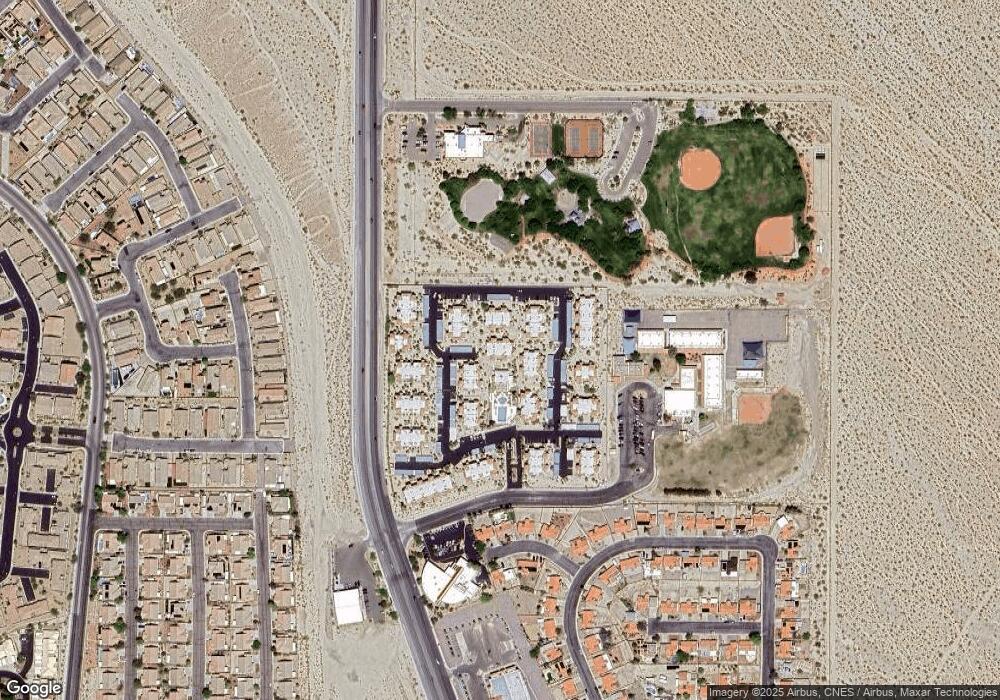
Map
Nearby Homes
- 1928 Las Palmas Ln Unit 228
- 1952 Las Palmas Ln Unit 232
- 1932 Las Palmas Ln Unit 283
- 1948 Las Palmas Ln Unit 277
- 1936 Las Palmas Ln Unit 185
- 1940 Las Palmas Ln Unit 272
- 1964 Las Palmas Ln Unit 141
- 1862 Maricopa Dr
- 2748 Brinkley Manor St
- 2823 Biscaya Dr
- 1851 Maricopa Dr
- 2772 Brinkley Manor St
- 2039 Port Royal Dr
- 2040 Port Royal Dr
- 2078 Willow Bay Rd
- 2822 La Palma Dr
- 2077 Alki Beach Ave
- 2079 Port Royal Dr
- 2847 Cattail Cove St
- 2721 Benton Cove St
- 1948 Las Palmas Ln Unit 177
- 1948 Las Palmas Ln Unit 180
- 1948 Las Palmas Ln Unit 280
- 1948 Las Palmas Ln Unit 279
- 1948 Las Palmas Ln Unit 178
- 1948 Las Palmas Ln Unit 179
- 1948 Las Palmas Ln
- 1952 Las Palmas Ln Unit 130
- 1952 Las Palmas Ln Unit 229
- 1952 Las Palmas Ln Unit 129
- 1952 Las Palmas Ln Unit 231
- 1952 Las Palmas Ln Unit 230
- 1952 Las Palmas Ln Unit 131
- 1952 Las Palmas Ln
- 1932 Las Palmas 283 Ln Unit 283
- 1932 Las Palmas Ln Unit 282
- 1932 Las Palmas Ln Unit 184
- 1932 Las Palmas Ln Unit 281
- 1932 Las Palmas Ln Unit 181
- 1932 Las Palmas Ln Unit 183