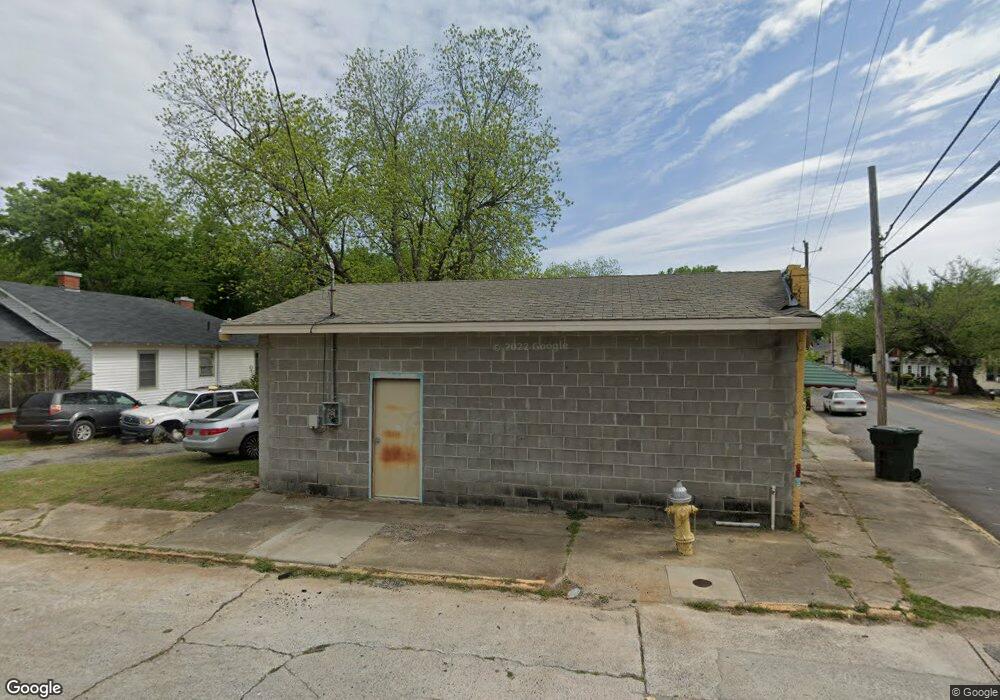
1949 2nd St Macon, GA 31201
Tindall Heights Historic District NeighborhoodEstimated Value: $45,904
--
Bed
--
Bath
650
Sq Ft
$71/Sq Ft
Est. Value
About This Home
This home is located at 1949 2nd St, Macon, GA 31201 and is currently estimated at $45,904, approximately $70 per square foot. 1949 2nd St is a home located in Bibb County with nearby schools including Ingram-Pye Elementary School, Central High School, and Cirrus Charter Academy.
Ownership History
Date
Name
Owned For
Owner Type
Purchase Details
Closed on
Oct 18, 2023
Sold by
Mccord Samuel Wade
Bought by
Kk Real Surplus Llc and Harris
Current Estimated Value
Purchase Details
Closed on
Apr 6, 1998
Sold by
Williams Albert B
Bought by
Harris Eugene and Harris Patricia Foster
Home Financials for this Owner
Home Financials are based on the most recent Mortgage that was taken out on this home.
Original Mortgage
$25,200
Interest Rate
7.81%
Mortgage Type
Commercial
Create a Home Valuation Report for This Property
The Home Valuation Report is an in-depth analysis detailing your home's value as well as a comparison with similar homes in the area
Home Values in the Area
Average Home Value in this Area
Purchase History
| Date | Buyer | Sale Price | Title Company |
|---|---|---|---|
| Kk Real Surplus Llc | $14,000 | None Listed On Document | |
| Harris Eugene | $26,000 | None Available |
Source: Public Records
Mortgage History
| Date | Status | Borrower | Loan Amount |
|---|---|---|---|
| Previous Owner | Harris Eugene | $25,200 |
Source: Public Records
Tax History Compared to Growth
Tax History
| Year | Tax Paid | Tax Assessment Tax Assessment Total Assessment is a certain percentage of the fair market value that is determined by local assessors to be the total taxable value of land and additions on the property. | Land | Improvement |
|---|---|---|---|---|
| 2025 | $526 | $21,401 | $13,158 | $8,243 |
| 2024 | $544 | $21,401 | $13,158 | $8,243 |
| 2023 | $616 | $20,780 | $13,158 | $7,622 |
| 2022 | $283 | $8,184 | $3,948 | $4,236 |
| 2021 | $311 | $8,184 | $3,948 | $4,236 |
| 2020 | $318 | $8,184 | $3,948 | $4,236 |
| 2019 | $320 | $8,184 | $3,948 | $4,236 |
| 2018 | $491 | $8,184 | $3,948 | $4,236 |
| 2017 | $307 | $8,184 | $3,948 | $4,236 |
| 2016 | $283 | $8,183 | $3,948 | $4,236 |
| 2015 | $401 | $8,183 | $3,948 | $4,236 |
| 2014 | $461 | $8,183 | $3,948 | $4,236 |
Source: Public Records
Map
Nearby Homes