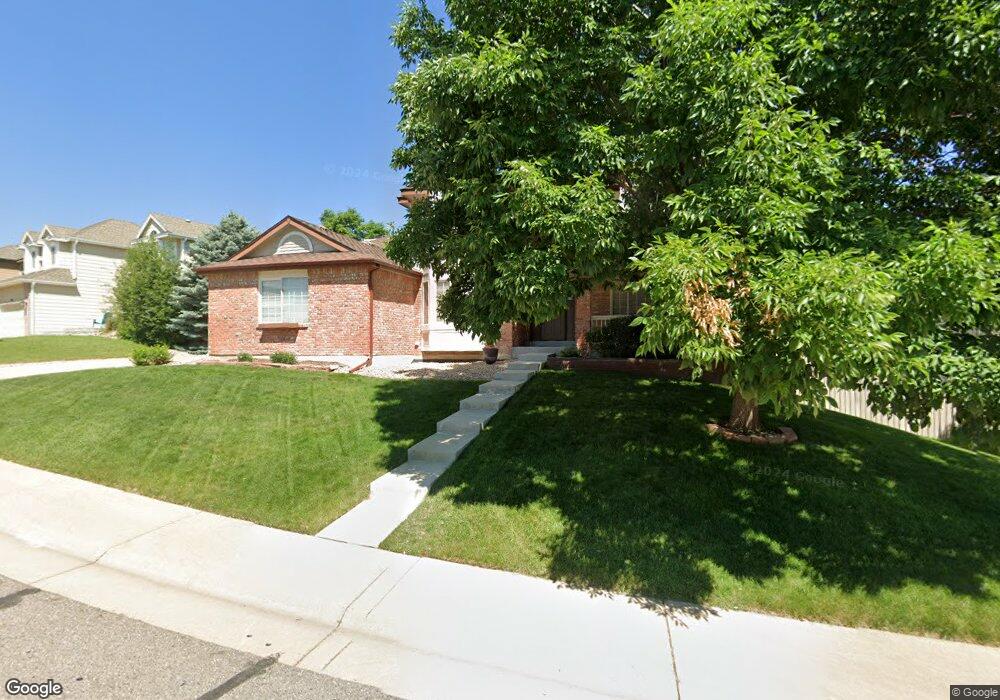
1949 Breen Ln Superior, CO 80027
Estimated Value: $895,000 - $1,068,000
4
Beds
3
Baths
2,296
Sq Ft
$417/Sq Ft
Est. Value
About This Home
This home is located at 1949 Breen Ln, Superior, CO 80027 and is currently estimated at $958,360, approximately $417 per square foot. 1949 Breen Ln is a home located in Boulder County with nearby schools including Eldorado K-8 School, Superior Elementary School, and Monarch High School.
Ownership History
Date
Name
Owned For
Owner Type
Purchase Details
Closed on
Aug 18, 2000
Sold by
Greiner Bruce A and Greiner Laura R
Bought by
Thorn Jeffrey
Current Estimated Value
Home Financials for this Owner
Home Financials are based on the most recent Mortgage that was taken out on this home.
Original Mortgage
$329,600
Outstanding Balance
$111,650
Interest Rate
7.87%
Estimated Equity
$846,710
Purchase Details
Closed on
Nov 12, 1993
Sold by
Richmond Homes Inc Ii
Bought by
Greiner Bruce A
Home Financials for this Owner
Home Financials are based on the most recent Mortgage that was taken out on this home.
Original Mortgage
$110,000
Interest Rate
6.86%
Purchase Details
Closed on
Mar 16, 1993
Bought by
Thorn Jeffrey and Thorn Celine
Purchase Details
Closed on
Aug 17, 1992
Bought by
Thorn Jeffrey and Thorn Celine
Create a Home Valuation Report for This Property
The Home Valuation Report is an in-depth analysis detailing your home's value as well as a comparison with similar homes in the area
Home Values in the Area
Average Home Value in this Area
Purchase History
| Date | Buyer | Sale Price | Title Company |
|---|---|---|---|
| Thorn Jeffrey | $412,000 | -- | |
| Greiner Bruce A | $209,690 | Land Title | |
| Thorn Jeffrey | -- | -- | |
| Thorn Jeffrey | -- | -- |
Source: Public Records
Mortgage History
| Date | Status | Borrower | Loan Amount |
|---|---|---|---|
| Open | Thorn Jeffrey | $329,600 | |
| Previous Owner | Greiner Bruce A | $110,000 | |
| Closed | Thorn Jeffrey | $20,600 |
Source: Public Records
Tax History
| Year | Tax Paid | Tax Assessment Tax Assessment Total Assessment is a certain percentage of the fair market value that is determined by local assessors to be the total taxable value of land and additions on the property. | Land | Improvement |
|---|---|---|---|---|
| 2025 | $5,142 | $55,988 | $28,069 | $27,919 |
| 2024 | $5,142 | $55,988 | $28,069 | $27,919 |
| 2023 | $5,072 | $56,327 | $24,803 | $35,209 |
| 2022 | $3,785 | $43,131 | $19,404 | $23,727 |
| 2021 | $4,871 | $48,234 | $21,700 | $26,534 |
| 2020 | $4,533 | $43,143 | $22,308 | $20,835 |
| 2019 | $4,470 | $43,143 | $22,308 | $20,835 |
| 2018 | $4,109 | $39,283 | $15,480 | $23,803 |
| 2017 | $4,200 | $43,430 | $17,114 | $26,316 |
| 2016 | $4,150 | $37,500 | $15,920 | $21,580 |
| 2015 | $3,944 | $32,739 | $12,258 | $20,481 |
| 2014 | $3,476 | $32,739 | $12,258 | $20,481 |
Source: Public Records
Map
Nearby Homes
- 954 Lasalle St
- 1009 Monarch Way
- 1057 Rand Way
- 1077 Rand Way
- 1302 Eldorado Dr
- 877 Eldorado Dr
- 1322 Eldorado Dr
- 977 Eldorado Dr
- 882 Eldorado Dr
- 1986 Estabrook Way
- 683 Eaton Cir
- 2280 Clayton Cir
- 743 Eaton Cir
- 1244 S Weldona Ln
- 2241 Dailey St
- 390 Andrew Way
- 1125 Stoneham St
- 2732 Flint Ct
- 1815 Spaulding Cir Unit 1815
- 1220 S Boyero Ct
Your Personal Tour Guide
Ask me questions while you tour the home.