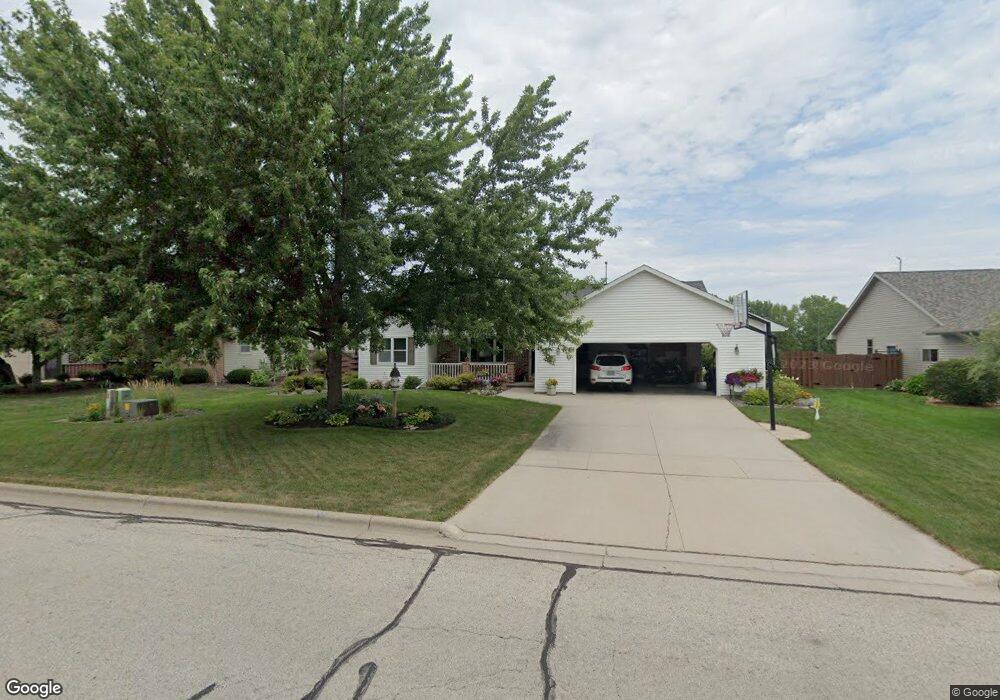
1949 Quindalee Rd de Pere, WI 54115
Estimated Value: $381,917 - $449,000
3
Beds
3
Baths
2,368
Sq Ft
$180/Sq Ft
Est. Value
About This Home
This home is located at 1949 Quindalee Rd, de Pere, WI 54115 and is currently estimated at $426,729, approximately $180 per square foot. 1949 Quindalee Rd is a home located in Brown County with nearby schools including Heritage Elementary School, De Pere Middle School, and Foxview Intermediate School.
Ownership History
Date
Name
Owned For
Owner Type
Purchase Details
Closed on
Jun 9, 2017
Sold by
Skaletski David J
Bought by
Smits Jody L
Current Estimated Value
Home Financials for this Owner
Home Financials are based on the most recent Mortgage that was taken out on this home.
Original Mortgage
$193,000
Outstanding Balance
$153,409
Interest Rate
2.5%
Mortgage Type
Adjustable Rate Mortgage/ARM
Estimated Equity
$273,320
Purchase Details
Closed on
Dec 9, 2009
Sold by
Hagerstrom Gary R
Bought by
Skaletski David J
Home Financials for this Owner
Home Financials are based on the most recent Mortgage that was taken out on this home.
Original Mortgage
$131,920
Interest Rate
5%
Mortgage Type
New Conventional
Purchase Details
Closed on
Feb 28, 2006
Sold by
Hagerstrom Kim M
Bought by
Hagerstrom Gary R
Create a Home Valuation Report for This Property
The Home Valuation Report is an in-depth analysis detailing your home's value as well as a comparison with similar homes in the area
Home Values in the Area
Average Home Value in this Area
Purchase History
| Date | Buyer | Sale Price | Title Company |
|---|---|---|---|
| Smits Jody L | $223,000 | Liberty Title | |
| Skaletski David J | $164,900 | None Available | |
| Hagerstrom Gary R | -- | None Available |
Source: Public Records
Mortgage History
| Date | Status | Borrower | Loan Amount |
|---|---|---|---|
| Open | Smits Jody L | $193,000 | |
| Previous Owner | Skaletski David J | $131,920 |
Source: Public Records
Tax History Compared to Growth
Tax History
| Year | Tax Paid | Tax Assessment Tax Assessment Total Assessment is a certain percentage of the fair market value that is determined by local assessors to be the total taxable value of land and additions on the property. | Land | Improvement |
|---|---|---|---|---|
| 2024 | $4,450 | $302,100 | $51,000 | $251,100 |
| 2023 | $3,966 | $302,100 | $51,000 | $251,100 |
| 2022 | $3,624 | $302,100 | $51,000 | $251,100 |
| 2021 | $3,352 | $217,500 | $42,500 | $175,000 |
| 2020 | $3,322 | $217,500 | $42,500 | $175,000 |
| 2019 | $3,560 | $217,500 | $42,500 | $175,000 |
| 2018 | $3,642 | $217,500 | $42,500 | $175,000 |
| 2017 | $3,615 | $217,500 | $42,500 | $175,000 |
| 2016 | $3,024 | $154,300 | $34,700 | $119,600 |
| 2015 | $3,173 | $154,300 | $34,700 | $119,600 |
| 2014 | $3,075 | $154,300 | $34,700 | $119,600 |
| 2013 | $3,075 | $154,300 | $34,700 | $119,600 |
Source: Public Records
Map
Nearby Homes
- 1871 Ledgeview Rd
- 1764 O'Hearn Ln
- 1764 Other
- 124 Shelley Ln
- 1960 Charles St
- 737 Desplaine Rd
- 1144 Jordan Rd
- 2200 Dickinson Rd
- 1820 Ridgeway Dr Unit 11A
- 1820 Ridgeway Dr Unit 11B
- 3910 Monroe Rd
- 240 Scout Way
- 1861 Chicago St
- 906 Silver St
- 658 Black Earth Dr
- 1403 Quinnette Ln
- 1653 Remington Ridge Way Unit 1653
- 1655 Remington Ridge Way Unit 1655
- 1658 Remington Ridge Way Unit 1658
- 318 S Webster Ave
- 1957 Quindalee Rd
- 1933 Quindalee Rd
- 1971 Quindalee Rd
- 1925 Quindalee Rd
- 1948 Quindalee Rd
- 1956 Quindalee Rd
- 1934 Quindalee Rd
- 575 Swan Rd
- 1911 Quindalee Rd
- 1985 Quindalee Rd
- 1926 Quindalee Rd
- 1912 Quindalee Rd
- 1984 Quindalee Rd
- 1991 Quindalee Rd
- 1903 Quindalee Rd
- 1949 Swan Pointe Terrace
- 1957 Swan Pointe Terrace
- 1933 Swan Pointe Terrace
- 1957 Swan Pointe Te
- 1925 Swan Pointe Terrace