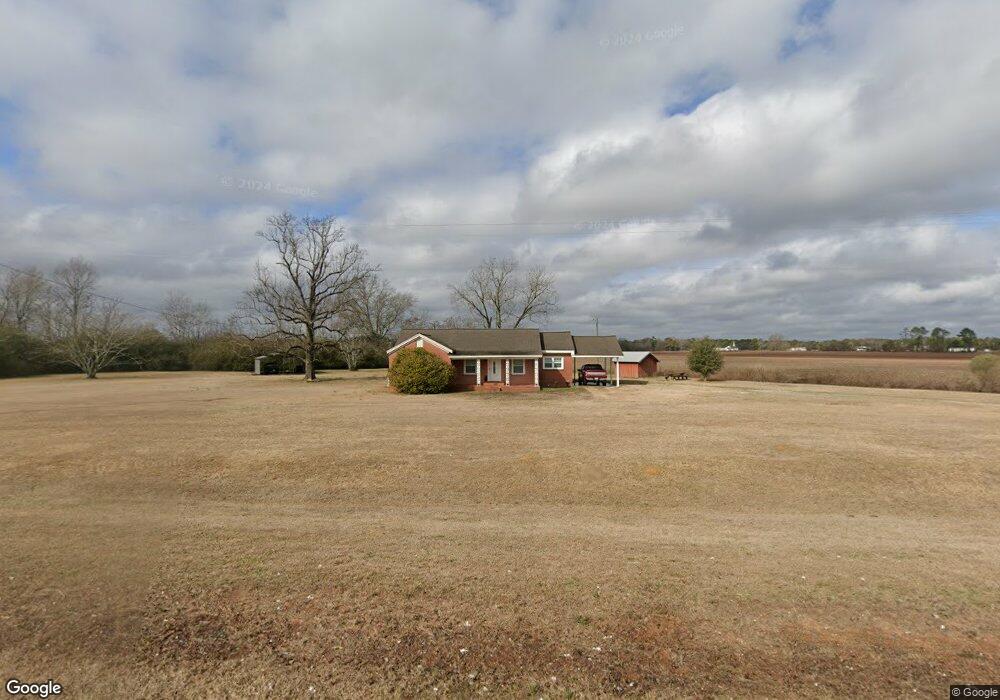
19491 Us Highway 27 Blakely, GA 39823
Estimated Value: $88,000 - $143,000
3
Beds
1
Bath
1,398
Sq Ft
$90/Sq Ft
Est. Value
About This Home
This home is located at 19491 Us Highway 27, Blakely, GA 39823 and is currently estimated at $126,482, approximately $90 per square foot. 19491 Us Highway 27 is a home located in Early County with nearby schools including Early County Elementary School, Early County Middle School, and Early County High School.
Ownership History
Date
Name
Owned For
Owner Type
Purchase Details
Closed on
Apr 2, 2015
Sold by
Slappy Stephen Armond
Bought by
Mock Malcolm Shane
Current Estimated Value
Purchase Details
Closed on
Jun 5, 2012
Sold by
Slappy Harmon Lamar
Bought by
Slappy Vera H and Slappy Stephen Armond
Purchase Details
Closed on
Mar 13, 2012
Sold by
Slappy Brian David
Bought by
Slappy Vera H and Slappy Stephen Armond
Purchase Details
Closed on
Mar 12, 2012
Sold by
Slappy Jackson Durell
Bought by
Slappy Vera H and Slappy Stephen Armond
Purchase Details
Closed on
Mar 9, 2012
Sold by
Slappy Harley James
Bought by
Slappy Vera H and Slappy Stephen Armond
Purchase Details
Closed on
Dec 27, 2011
Sold by
Slappy Stephen Armond and Slappy Vera Houston
Bought by
Slappy Stephen Armond and Slappy Brian David
Purchase Details
Closed on
Mar 14, 2008
Sold by
Slappey Vera H
Bought by
Departmetn Of Transportion
Create a Home Valuation Report for This Property
The Home Valuation Report is an in-depth analysis detailing your home's value as well as a comparison with similar homes in the area
Home Values in the Area
Average Home Value in this Area
Purchase History
| Date | Buyer | Sale Price | Title Company |
|---|---|---|---|
| Mock Malcolm Shane | $42,000 | -- | |
| Slappy Vera H | $5,000 | -- | |
| Slappy Vera H | $5,000 | -- | |
| Slappy Vera H | $5,000 | -- | |
| Slappy Stephen Armond | $5,000 | -- | |
| Slappy Vera H | $5,000 | -- | |
| Slappy Stephen Armond | -- | -- | |
| Departmetn Of Transportion | -- | -- |
Source: Public Records
Tax History Compared to Growth
Tax History
| Year | Tax Paid | Tax Assessment Tax Assessment Total Assessment is a certain percentage of the fair market value that is determined by local assessors to be the total taxable value of land and additions on the property. | Land | Improvement |
|---|---|---|---|---|
| 2024 | $1,033 | $40,370 | $3,567 | $36,803 |
| 2023 | $977 | $40,370 | $3,567 | $36,803 |
| 2022 | $956 | $39,922 | $3,000 | $36,922 |
| 2021 | $843 | $35,115 | $3,000 | $32,115 |
| 2020 | $807 | $34,314 | $3,000 | $31,314 |
| 2019 | $775 | $32,108 | $3,000 | $29,108 |
| 2018 | $765 | $31,745 | $3,000 | $28,745 |
| 2017 | $766 | $31,745 | $3,000 | $28,745 |
| 2016 | $394 | $29,230 | $3,000 | $26,230 |
| 2015 | -- | $28,230 | $2,830 | $25,401 |
| 2014 | -- | $28,231 | $2,830 | $25,401 |
| 2013 | -- | $28,230 | $2,830 | $25,400 |
Source: Public Records
Map
Nearby Homes
- 1412 Clark Rd
- Bluffton Ga
- 00 N Woodlawn Dr
- 16 Woodlawn Dr
- 115 S Central Ave
- 507 Lakewood Dr
- 0000 Martin Luther King Junior Blvd
- 507 Js McLeod Jr Way
- 1827 Tarver Dr
- 21 E Railroad Ln
- 000 Georgia 62
- 4497 Simmons Dairy Rd
- Grimsley Mill Rd
- 337 College St
- 234 College St
- 76 S Jefferson Ave
- 73 W Westward Ave
- Bluffton Rd
- Gin Pond
- 73 Grove Place