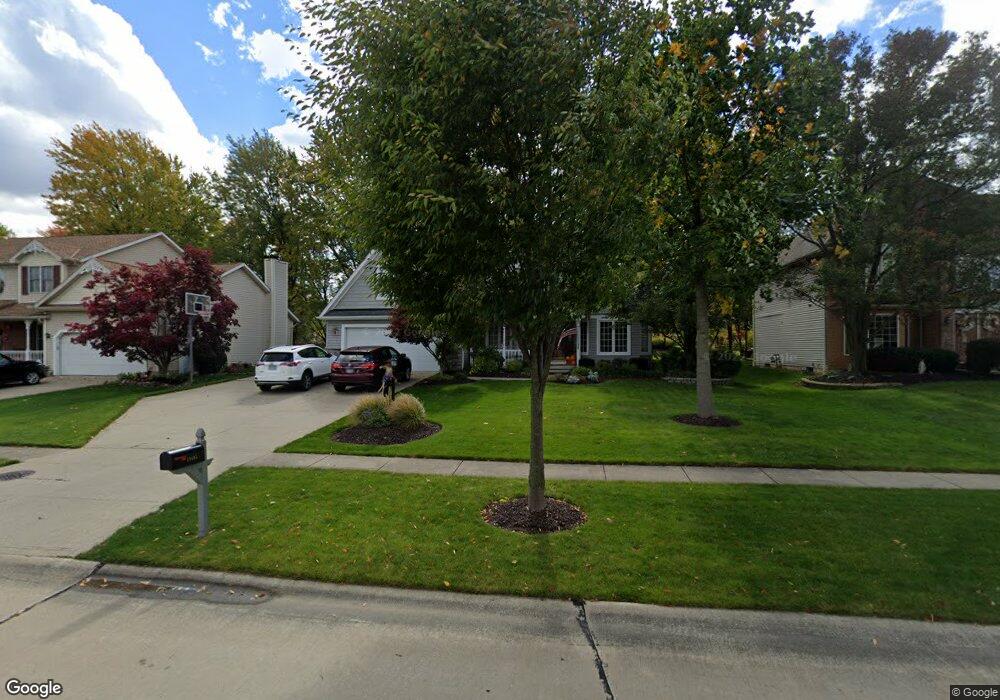
19495 Trotwood Park Strongsville, OH 44149
Estimated Value: $394,000 - $450,000
4
Beds
3
Baths
2,366
Sq Ft
$175/Sq Ft
Est. Value
About This Home
This home is located at 19495 Trotwood Park, Strongsville, OH 44149 and is currently estimated at $415,138, approximately $175 per square foot. 19495 Trotwood Park is a home located in Cuyahoga County with nearby schools including Strongsville High School, Strongsville Academy, and Sts Joseph & John Interparochial School.
Ownership History
Date
Name
Owned For
Owner Type
Purchase Details
Closed on
Feb 19, 2024
Sold by
Mott Stephen T and Mott Denice A
Bought by
Stephen T Mott And Denice A Mott Trust and Mott
Current Estimated Value
Purchase Details
Closed on
Jun 17, 1998
Sold by
Straw Robert A and Straw Doreen M
Bought by
Mott Steven T and Mott Denice A
Home Financials for this Owner
Home Financials are based on the most recent Mortgage that was taken out on this home.
Original Mortgage
$173,600
Interest Rate
7.22%
Purchase Details
Closed on
Jul 31, 1991
Sold by
Mararschhauser Joseph
Bought by
Straw Robert A
Purchase Details
Closed on
May 29, 1991
Bought by
Mararschhauser Joseph
Purchase Details
Closed on
Dec 8, 1989
Bought by
Perram Bros. Construction
Purchase Details
Closed on
Jan 1, 1989
Bought by
Crystal Creek Dev
Create a Home Valuation Report for This Property
The Home Valuation Report is an in-depth analysis detailing your home's value as well as a comparison with similar homes in the area
Home Values in the Area
Average Home Value in this Area
Purchase History
| Date | Buyer | Sale Price | Title Company |
|---|---|---|---|
| Stephen T Mott And Denice A Mott Trust | -- | None Listed On Document | |
| Mott Steven T | $217,000 | National Title Agency | |
| Straw Robert A | $206,000 | -- | |
| Mararschhauser Joseph | $210,800 | -- | |
| Perram Bros. Construction | -- | -- | |
| Crystal Creek Dev | -- | -- |
Source: Public Records
Mortgage History
| Date | Status | Borrower | Loan Amount |
|---|---|---|---|
| Previous Owner | Mott Steven T | $173,600 |
Source: Public Records
Tax History Compared to Growth
Tax History
| Year | Tax Paid | Tax Assessment Tax Assessment Total Assessment is a certain percentage of the fair market value that is determined by local assessors to be the total taxable value of land and additions on the property. | Land | Improvement |
|---|---|---|---|---|
| 2024 | $5,959 | $126,910 | $27,825 | $99,085 |
| 2023 | $6,163 | $98,430 | $23,840 | $74,590 |
| 2022 | $6,118 | $98,420 | $23,840 | $74,590 |
| 2021 | $6,070 | $98,420 | $23,840 | $74,590 |
| 2020 | $6,237 | $89,460 | $21,670 | $67,800 |
| 2019 | $6,054 | $255,600 | $61,900 | $193,700 |
| 2018 | $5,494 | $89,460 | $21,670 | $67,800 |
| 2017 | $5,420 | $81,700 | $16,910 | $64,790 |
| 2016 | $5,376 | $81,700 | $16,910 | $64,790 |
| 2015 | $5,094 | $81,700 | $16,910 | $64,790 |
| 2014 | $5,094 | $76,340 | $15,790 | $60,550 |
Source: Public Records
Map
Nearby Homes
- 19513 Lunn Rd
- 19620 Porters Ln Unit 15F
- 14112 Settlers Way
- 20078 Trapper Trail
- 19160 Wheelers Ln
- 18630 Shurmer Rd
- 15279 Walnut Creek Dr
- 15017 Regency Dr
- 19311 Bradford Ct
- 19908 Stoughton Dr
- 13156 Olympus Way
- 18162 Fawn Cir
- 13099 Olympus Way
- 13066 Olympus Way
- 20678 Spruce Dr
- 14896 Britannia Ct
- 19297 Lauren Way
- 13236 Tomson Dr
- 17069 Partridge Dr
- 14890 Prospect Rd
- 19523 Trotwood Park
- 19467 Trotwood Park
- 19551 Trotwood Park
- 19434 Winding Trail
- 19439 Trotwood Park
- 19456 Winding Trail
- 19474 Winding Trail
- 19416 Winding Trail
- 19508 Trotwood Park
- 19480 Trotwood Park
- 19536 Trotwood Park
- 19579 Trotwood Park
- 19496 Winding Trail
- 19411 Trotwood Park
- 19564 Trotwood Park
- 19452 Trotwood Park
- 19398 Winding Trail
- 19514 Winding Trail
- 19592 Trotwood Park
- 19424 Trotwood Park