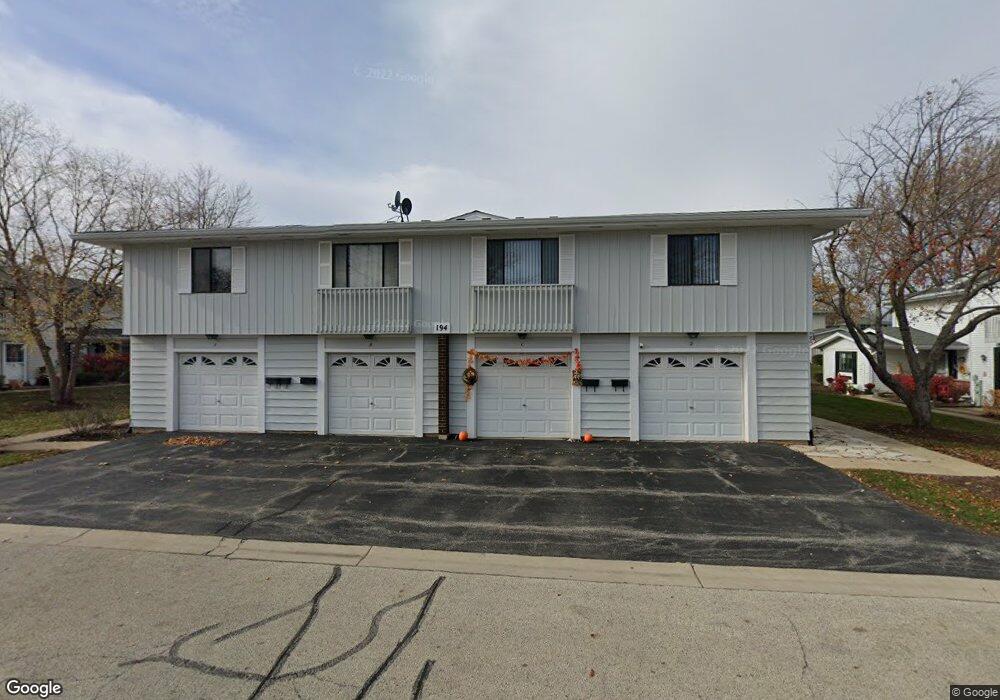
194B Duxbury Ct Unit 304 Bloomingdale, IL 60108
Estimated Value: $313,000 - $335,000
2
Beds
2
Baths
1,531
Sq Ft
$214/Sq Ft
Est. Value
About This Home
This home is located at 194B Duxbury Ct Unit 304, Bloomingdale, IL 60108 and is currently estimated at $327,624, approximately $213 per square foot. 194B Duxbury Ct Unit 304 is a home located in DuPage County with nearby schools including Dujardin Elementary School, Westfield Middle School, and Lake Park High School.
Ownership History
Date
Name
Owned For
Owner Type
Purchase Details
Closed on
Jun 10, 2025
Sold by
R Home Investments Llc
Bought by
Dituri Joseph
Current Estimated Value
Home Financials for this Owner
Home Financials are based on the most recent Mortgage that was taken out on this home.
Original Mortgage
$260,124
Outstanding Balance
$259,570
Interest Rate
7.75%
Mortgage Type
New Conventional
Estimated Equity
$68,054
Purchase Details
Closed on
Aug 11, 2023
Sold by
B-Dale Llc
Bought by
R Home Investments Llc
Home Financials for this Owner
Home Financials are based on the most recent Mortgage that was taken out on this home.
Original Mortgage
$183,750
Interest Rate
6.96%
Mortgage Type
FHA
Purchase Details
Closed on
Dec 13, 2016
Sold by
Chicago Title Land Trust Company
Bought by
B Dale Llc
Create a Home Valuation Report for This Property
The Home Valuation Report is an in-depth analysis detailing your home's value as well as a comparison with similar homes in the area
Home Values in the Area
Average Home Value in this Area
Purchase History
| Date | Buyer | Sale Price | Title Company |
|---|---|---|---|
| Dituri Joseph | $330,000 | None Listed On Document | |
| R Home Investments Llc | $245,000 | None Listed On Document | |
| B Dale Llc | -- | Chicago Title Land Trust Co |
Source: Public Records
Mortgage History
| Date | Status | Borrower | Loan Amount |
|---|---|---|---|
| Open | Dituri Joseph | $260,124 | |
| Previous Owner | R Home Investments Llc | $183,750 |
Source: Public Records
Tax History Compared to Growth
Tax History
| Year | Tax Paid | Tax Assessment Tax Assessment Total Assessment is a certain percentage of the fair market value that is determined by local assessors to be the total taxable value of land and additions on the property. | Land | Improvement |
|---|---|---|---|---|
| 2024 | $4,242 | $65,293 | $9,142 | $56,151 |
| 2023 | $3,890 | $59,710 | $8,360 | $51,350 |
| 2022 | $4,567 | $62,320 | $8,320 | $54,000 |
| 2021 | $4,404 | $59,210 | $7,900 | $51,310 |
| 2020 | $4,453 | $57,770 | $7,710 | $50,060 |
| 2019 | $4,312 | $55,520 | $7,410 | $48,110 |
| 2018 | $4,405 | $57,490 | $7,220 | $50,270 |
| 2017 | $4,186 | $53,280 | $6,690 | $46,590 |
| 2016 | $4,047 | $49,310 | $6,190 | $43,120 |
| 2015 | $4,002 | $46,020 | $5,780 | $40,240 |
| 2014 | $2,841 | $31,740 | $5,780 | $25,960 |
| 2013 | $2,802 | $32,830 | $5,980 | $26,850 |
Source: Public Records
Map
Nearby Homes
- 195 Duxbury Ct Unit D
- 120 Brewster Ct Unit D
- 135 Fairlane Ct Unit B
- 181 Lakeview Ct
- 253 Sterling Ln
- 158 S Prairie Ave
- 161 N Waters Edge Dr Unit 202
- 201 N Waters Edge Dr Unit 101
- 166 W Lake St
- 2257 Lake Ridge Dr Unit 74
- 148 Longridge Dr
- 169 E Lake Ridge Dr Unit 21
- 119 W Lake St
- 2158 College Dr Unit 7
- 2155 College Dr Unit 7
- 224 Oakwood Ln
- 177 Cardinal Dr
- 120 Lakeview Dr Unit 513
- 120 Lakeview Dr Unit 514
- 120 Lakeview Dr Unit 109
- 194C Duxbury Ct Unit 302
- 132D Fairlane Ct Unit 271
- 192D Duxbury Ct Unit 311
- 151 Chatham Ct Unit D
- 199 Duxbury Ct Unit D
- 119 Fairlane Ct Unit A
- 154 Quincy Ct Unit D
- 119 Fairlane Ct Unit B
- 151 Chatham Ct Unit 374
- 136 Brewster Ct Unit A
- 136 Brewster Ct Unit B
- 119 Fairlane Ct Unit C
- 127 Brewster Ct Unit C
- 127 Brewster Ct Unit B
- 154 Quincy Ct Unit C
- 127 Brewster Ct Unit A
- 158 Quincy Ct Unit C
- 158 Quincy Ct Unit A
- 158 Quincy Ct Unit 231
- 154 Quincy Ct Unit B