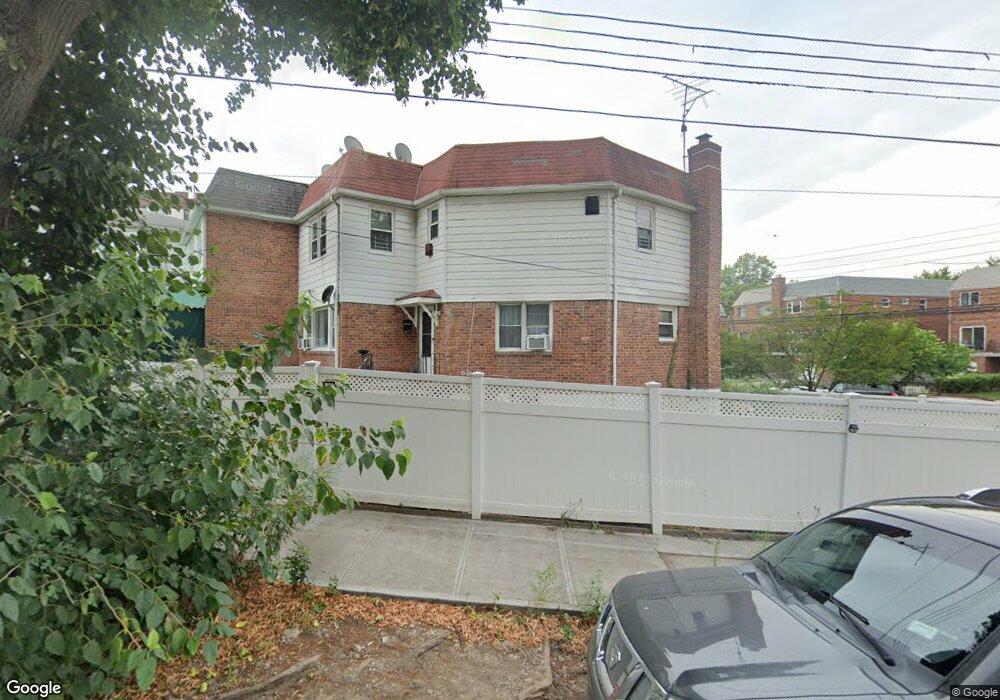
195-37 Sagamore Ave Hollis, NY 11423
Hollis NeighborhoodEstimated Value: $657,000 - $786,000
3
Beds
2
Baths
1,688
Sq Ft
$435/Sq Ft
Est. Value
About This Home
This home is located at 195-37 Sagamore Ave, Hollis, NY 11423 and is currently estimated at $733,989, approximately $434 per square foot. 195-37 Sagamore Ave is a home located in Queens County with nearby schools including P.S. 35 Nathaniel Woodhull, I.S. 238 Susan B Anthony Academy, and Wellspring Elementary & Middle.
Ownership History
Date
Name
Owned For
Owner Type
Purchase Details
Closed on
Oct 6, 2017
Sold by
Butt Azhar M and Butt Moeen J
Bought by
Hossain Faria and Hossain Rahman
Current Estimated Value
Home Financials for this Owner
Home Financials are based on the most recent Mortgage that was taken out on this home.
Original Mortgage
$418,950
Outstanding Balance
$347,870
Interest Rate
3.78%
Mortgage Type
New Conventional
Estimated Equity
$386,119
Purchase Details
Closed on
Apr 18, 2005
Sold by
Boyce Aubrey and Boyce Frances J
Bought by
Butt Azhar M and Butt Moeen J
Purchase Details
Closed on
May 11, 1999
Sold by
Archibold Raquel E
Bought by
Boyce Aubrey and Boyce Frances J
Create a Home Valuation Report for This Property
The Home Valuation Report is an in-depth analysis detailing your home's value as well as a comparison with similar homes in the area
Home Values in the Area
Average Home Value in this Area
Purchase History
| Date | Buyer | Sale Price | Title Company |
|---|---|---|---|
| Hossain Faria | $470,000 | -- | |
| Hossain Faria | $470,000 | -- | |
| Hossain Faria | $470,000 | -- | |
| Hossain Faria | $470,000 | -- | |
| Butt Azhar M | $365,000 | -- | |
| Butt Azhar M | $365,000 | -- | |
| Butt Azhar M | $365,000 | -- | |
| Butt Azhar M | $365,000 | -- | |
| Boyce Aubrey | $160,000 | Judicial Title | |
| Boyce Aubrey | $160,000 | Judicial Title | |
| Boyce Aubrey | $160,000 | Judicial Title | |
| Boyce Aubrey | $160,000 | Judicial Title |
Source: Public Records
Mortgage History
| Date | Status | Borrower | Loan Amount |
|---|---|---|---|
| Open | Hossain Faria | $418,950 | |
| Closed | Hossain Faria | $418,950 |
Source: Public Records
Tax History Compared to Growth
Tax History
| Year | Tax Paid | Tax Assessment Tax Assessment Total Assessment is a certain percentage of the fair market value that is determined by local assessors to be the total taxable value of land and additions on the property. | Land | Improvement |
|---|---|---|---|---|
| 2025 | $5,997 | $30,758 | $11,947 | $18,811 |
| 2024 | $5,997 | $29,860 | $11,893 | $17,967 |
| 2023 | $5,997 | $29,860 | $12,151 | $17,709 |
| 2022 | $5,749 | $42,420 | $16,920 | $25,500 |
| 2021 | $5,718 | $36,780 | $16,920 | $19,860 |
| 2020 | $5,426 | $31,620 | $16,920 | $14,700 |
| 2019 | $5,205 | $34,080 | $16,920 | $17,160 |
| 2018 | $5,072 | $24,883 | $13,950 | $10,933 |
| 2017 | $4,892 | $23,999 | $15,039 | $8,960 |
| 2016 | $4,526 | $23,999 | $15,039 | $8,960 |
| 2015 | $2,810 | $21,360 | $14,520 | $6,840 |
| 2014 | $2,810 | $20,736 | $13,786 | $6,950 |
Source: Public Records
Map
Nearby Homes
- 9141 195th St
- 19511 Woodhull Ave
- 19515 Woodhull Ave
- 92-22 195th Place
- 9317 197th St
- 197-21 Carpenter Ave Unit 1G
- 197-31 Carpenter Ave
- 191-13 Jamaica Ave
- 89-48 196th St
- 19624 90th Ave
- 19611 100th Ave
- 94-72 199th St
- 90-35 198th St
- 188-14 Woodhull Ave
- 188-09 Jamaica Ave
- 88-27 196th St
- 100-32 199th St
- 190-30 103rd Ave
- 93-17 201st St
- 8817 190th St
- 19521 Sagamore Ave
- 19525 Sagamore Ave
- 19519 Sagamore Ave
- 19527 Sagamore Ave
- 19527 Sagamore Ave
- 19516 Woodhull Ave
- 19531 Sagamore Ave
- 195-16 Woodhull Ave
- 195-14 Woodhull Ave
- 19514 Woodhull Ave
- 195-21 Carpenter Ave
- 19537 Sagamore Ave
- 19504 Carpenter Ave
- 19530 Sagamore Ave
- 19506 Woodhull Ave
- 195-14 Sagamore Ave
- 19509 Carpenter Ave
- 19536 Sagamore Ave
- 19518 Sagamore Ave
- 19508 Carpenter Ave