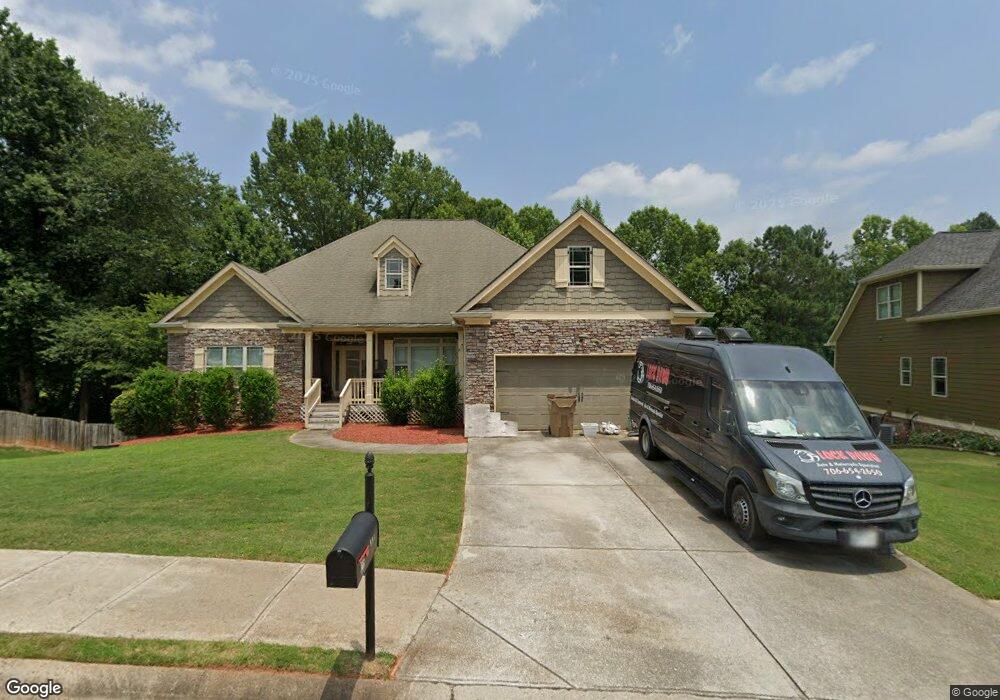
195 Braselton Farms Dr Hoschton, GA 30548
Estimated Value: $368,000 - $498,000
3
Beds
2
Baths
2,041
Sq Ft
$203/Sq Ft
Est. Value
About This Home
This home is located at 195 Braselton Farms Dr, Hoschton, GA 30548 and is currently estimated at $414,399, approximately $203 per square foot. 195 Braselton Farms Dr is a home located in Jackson County with nearby schools including Gum Springs Elementary School, West Jackson Middle School, and Jackson County High School.
Ownership History
Date
Name
Owned For
Owner Type
Purchase Details
Closed on
Sep 9, 2021
Sold by
P4 Sfr Property Owner 1 Llc
Bought by
Progress Residential Hvh Borrower Llc
Current Estimated Value
Purchase Details
Closed on
Mar 19, 2020
Sold by
Progress Residential Borrower 12 Llc
Bought by
P4 Sfr Property Owner 1 Llc
Purchase Details
Closed on
Nov 3, 2015
Sold by
Freo Georgia Llc
Bought by
Progress Residential 2015 3 Bo
Home Financials for this Owner
Home Financials are based on the most recent Mortgage that was taken out on this home.
Original Mortgage
$449,712,992
Interest Rate
3.78%
Mortgage Type
New Conventional
Purchase Details
Closed on
Jun 28, 2013
Sold by
Gwinnett Community Bank
Bought by
Freo Georgia Llc
Purchase Details
Closed on
Oct 7, 2008
Sold by
Custom Dream Homes Llc
Bought by
Gwinnett Community Bank
Purchase Details
Closed on
Oct 18, 2006
Sold by
Not Provided
Bought by
Gwinnett Community Bank
Create a Home Valuation Report for This Property
The Home Valuation Report is an in-depth analysis detailing your home's value as well as a comparison with similar homes in the area
Home Values in the Area
Average Home Value in this Area
Purchase History
| Date | Buyer | Sale Price | Title Company |
|---|---|---|---|
| Progress Residential Hvh Borrower Llc | -- | -- | |
| P4 Sfr Property Owner 1 Llc | -- | -- | |
| Progress Residential 2015 3 Bo | -- | -- | |
| Freo Georgia Llc | $193,595 | -- | |
| Gwinnett Community Bank | -- | -- | |
| Gwinnett Community Bank | $60,000 | -- |
Source: Public Records
Mortgage History
| Date | Status | Borrower | Loan Amount |
|---|---|---|---|
| Previous Owner | Progress Residential 2015 3 Bo | $449,712,992 |
Source: Public Records
Tax History Compared to Growth
Tax History
| Year | Tax Paid | Tax Assessment Tax Assessment Total Assessment is a certain percentage of the fair market value that is determined by local assessors to be the total taxable value of land and additions on the property. | Land | Improvement |
|---|---|---|---|---|
| 2024 | $3,541 | $133,600 | $18,000 | $115,600 |
| 2023 | $3,541 | $128,520 | $18,000 | $110,520 |
| 2022 | $2,968 | $99,320 | $10,000 | $89,320 |
| 2021 | $2,988 | $99,320 | $10,000 | $89,320 |
| 2020 | $2,712 | $82,160 | $10,000 | $72,160 |
| 2019 | $2,752 | $82,160 | $10,000 | $72,160 |
| 2018 | $2,672 | $78,720 | $10,000 | $68,720 |
| 2017 | $2,527 | $73,724 | $10,000 | $63,724 |
| 2016 | $2,541 | $73,724 | $10,000 | $63,724 |
| 2015 | $2,537 | $73,724 | $10,000 | $63,724 |
| 2014 | $2,500 | $72,496 | $10,000 | $62,496 |
| 2013 | -- | $72,496 | $10,000 | $62,496 |
Source: Public Records
Map
Nearby Homes
- 144 Braselton Farms Dr
- 387 Fern Ct
- 389 Aidens Bluff
- 363 Aidens Bluff
- 565 Skelton Rd
- 1084 Skelton Rd
- 255 Lucas Ct
- 126 Summerhill Dr
- 265 Laurel Cove Dr
- 113 Skelton Rd
- 485 Delaperriere Lot 44 D Loop
- 485 Delaperriere D Loop Unit LOT 44
- 463 Delaperriere Loop
- 41 Doster Crest Rd
- 847 Wellford Ave
- 1049 Amber Waves Ave
- 105 Creek View Dr
- 4457 Waxwing St
- 179 Braselton Farms Dr
- 207 Braselton Farms Dr
- 223 Braselton Farms Dr
- 165 Braselton Farms Dr
- 188 Braselton Farms Dr
- 188 Braselton Farms Dr Unit 15
- 202 Braselton Farms Dr Unit 16
- 202 Braselton Farms Dr
- 168 Braselton Farms Dr
- 214 Braselton Farms Trail
- 214 Braselton Farms Dr
- 241 Braselton Farms Dr Unit 25
- 241 Braselton Farms Dr
- 143 Braselton Farms Dr
- 228 Braselton Farms Dr Unit 18
- 228 Braselton Farms Dr
- 1825 Skelton Rd
- 132 Braselton Farms Dr
- 121 Braselton Farms Dr
- 236 Braselton Farms Dr Unit 19