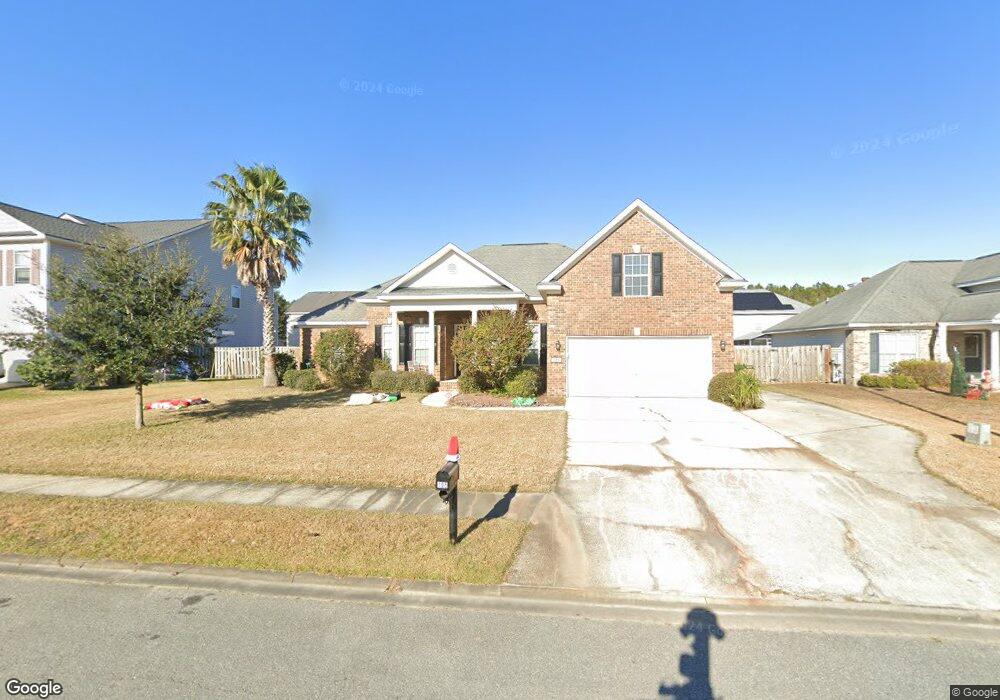
195 Byron Dr Richmond Hill, GA 31324
Estimated Value: $388,000 - $414,000
5
Beds
2
Baths
2,248
Sq Ft
$178/Sq Ft
Est. Value
About This Home
This home is located at 195 Byron Dr, Richmond Hill, GA 31324 and is currently estimated at $399,670, approximately $177 per square foot. 195 Byron Dr is a home located in Bryan County with nearby schools including Richmond Hill Primary School, Dr. George Washington Carver Elementary School, and Richmond Hill Elementary School.
Ownership History
Date
Name
Owned For
Owner Type
Purchase Details
Closed on
Jun 9, 2011
Sold by
Wilde Jacob Allan
Bought by
Schuler William Patrick and Schuler Amy L.
Current Estimated Value
Home Financials for this Owner
Home Financials are based on the most recent Mortgage that was taken out on this home.
Original Mortgage
$246,181
Outstanding Balance
$169,871
Interest Rate
4.65%
Mortgage Type
VA
Estimated Equity
$229,799
Purchase Details
Closed on
May 18, 2007
Sold by
Srh Investments Llc
Bought by
Wilde Jacob Allan
Home Financials for this Owner
Home Financials are based on the most recent Mortgage that was taken out on this home.
Original Mortgage
$258,900
Interest Rate
6.12%
Mortgage Type
New Conventional
Purchase Details
Closed on
Jun 21, 2006
Sold by
Hallmark Development Co In
Bought by
Srh Investments Llc
Purchase Details
Closed on
Apr 20, 2006
Sold by
Bls Development Inc
Bought by
Hallmark Development Co Inc
Create a Home Valuation Report for This Property
The Home Valuation Report is an in-depth analysis detailing your home's value as well as a comparison with similar homes in the area
Home Values in the Area
Average Home Value in this Area
Purchase History
| Date | Buyer | Sale Price | Title Company |
|---|---|---|---|
| Schuler William Patrick | $241,000 | -- | |
| Wilde Jacob Allan | $258,900 | -- | |
| Srh Investments Llc | $45,000 | -- | |
| Hallmark Development Co Inc | $51,800 | -- |
Source: Public Records
Mortgage History
| Date | Status | Borrower | Loan Amount |
|---|---|---|---|
| Open | Schuler William Patrick | $246,181 | |
| Previous Owner | Wilde Jacob Allan | $258,900 |
Source: Public Records
Tax History Compared to Growth
Tax History
| Year | Tax Paid | Tax Assessment Tax Assessment Total Assessment is a certain percentage of the fair market value that is determined by local assessors to be the total taxable value of land and additions on the property. | Land | Improvement |
|---|---|---|---|---|
| 2024 | $3,830 | $132,520 | $30,800 | $101,720 |
| 2023 | $3,756 | $117,400 | $30,800 | $86,600 |
| 2022 | $3,381 | $112,360 | $30,800 | $81,560 |
| 2021 | $3,129 | $102,560 | $30,800 | $71,760 |
| 2020 | $2,878 | $99,160 | $30,800 | $68,360 |
| 2019 | $3,058 | $98,160 | $30,800 | $67,360 |
| 2018 | $2,461 | $93,360 | $26,000 | $67,360 |
| 2017 | $2,421 | $98,000 | $26,400 | $71,600 |
| 2016 | $2,472 | $99,160 | $26,400 | $72,760 |
| 2015 | $2,453 | $97,640 | $26,400 | $71,240 |
| 2014 | $2,412 | $96,000 | $24,000 | $72,000 |
Source: Public Records
Map
Nearby Homes
- 179 Byron Dr
- 219 Byron Dr
- 40 Patton Ln
- 267 Young Way
- 200 Oleander St
- 177 Spruce St
- 110 Laurel St
- 78 & 78 A Spruce St
- The Albatross Plan at Ogeechee Station
- 285 Rushing St
- 130 Stafford Loop
- 122 Stafford Loop
- 126 Stafford Loop
- 96 Stafford Loop
- 73 Dorsey Dr
- 87 Stafford Loop
- 91 Stafford Loop
- 81 Dorsey Dr
- 59 Stafford Loop
- 67 Stafford Loop