Estimated Value: $325,079 - $493,000
2
Beds
1
Bath
810
Sq Ft
$506/Sq Ft
Est. Value
About This Home
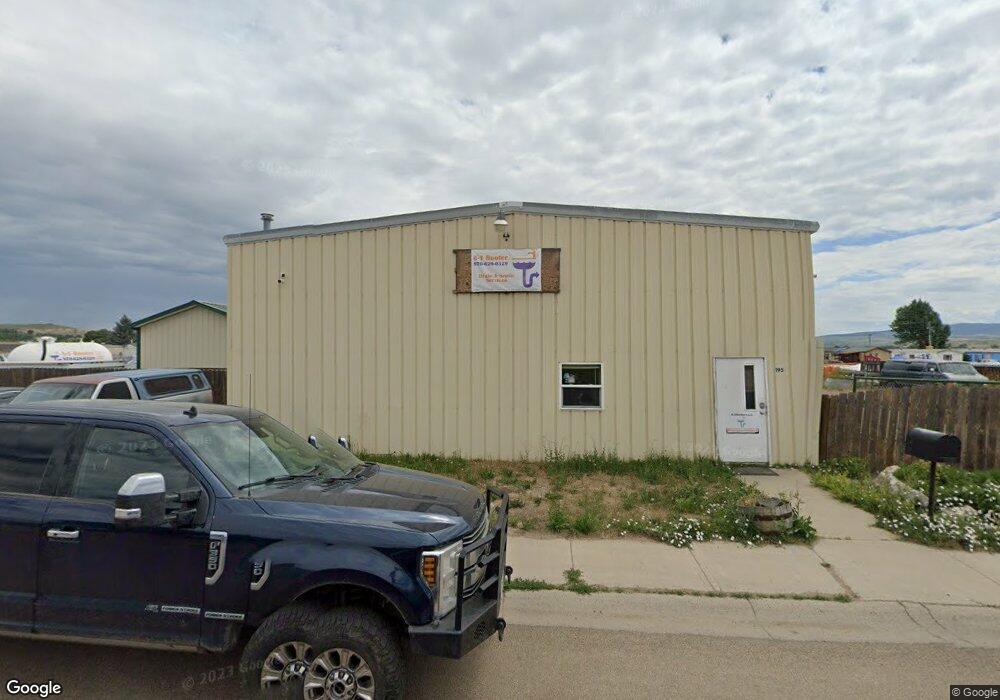
This home is located at 195 Clay Ave Unit LOT 802 WILDERNESS R, Craig, CO 81625 and is currently estimated at $409,520, approximately $505 per square foot. 195 Clay Ave Unit LOT 802 WILDERNESS R is a home located in Moffat County with nearby schools including Ridgeview Elementary School, Moffat County High School, and Calvary Baptist School.
Ownership History
Date
Name
Owned For
Owner Type
Purchase Details
Closed on
Sep 17, 2021
Sold by
Hull Naomi T
Bought by
Hull Naomi T and Saccomano Jeffrey J
Current Estimated Value
Purchase Details
Closed on
Sep 14, 2021
Sold by
Hull Donna C
Bought by
Hull Naomi T
Purchase Details
Closed on
Aug 10, 2015
Sold by
Creedon Timothy G and Creedon Doris L
Bought by
Hull Naomi T and Hull Donna C
Purchase Details
Closed on
Dec 27, 2011
Sold by
Creedon Timothy G and Creedon Doris J
Bought by
Creedon Timothy G and Creedon Doris L
Home Financials for this Owner
Home Financials are based on the most recent Mortgage that was taken out on this home.
Original Mortgage
$74,338
Interest Rate
3.95%
Mortgage Type
New Conventional
Purchase Details
Closed on
Aug 24, 2005
Sold by
Johnmeyer Glenn J and Johnmeyer Andrea D
Bought by
Creedon Timothy G and Creedon Christine J
Create a Home Valuation Report for This Property
The Home Valuation Report is an in-depth analysis detailing your home's value as well as a comparison with similar homes in the area
Home Values in the Area
Average Home Value in this Area
Purchase History
| Date | Buyer | Sale Price | Title Company |
|---|---|---|---|
| Hull Naomi T | -- | None Available | |
| Hull Naomi T | $110,000 | None Available | |
| Hull Naomi T | $210,000 | None Available | |
| Creedon Timothy G | -- | Boston National Title | |
| Creedon Timothy G | -- | Boston National Title | |
| Creedon Timothy G | $185,000 | None Available |
Source: Public Records
Mortgage History
| Date | Status | Borrower | Loan Amount |
|---|---|---|---|
| Previous Owner | Creedon Timothy G | $74,338 |
Source: Public Records
Tax History Compared to Growth
Tax History
| Year | Tax Paid | Tax Assessment Tax Assessment Total Assessment is a certain percentage of the fair market value that is determined by local assessors to be the total taxable value of land and additions on the property. | Land | Improvement |
|---|---|---|---|---|
| 2024 | $692 | $10,770 | $0 | $0 |
| 2023 | $692 | $10,770 | $5,220 | $5,550 |
| 2022 | $685 | $11,090 | $6,210 | $4,880 |
| 2021 | $688 | $11,410 | $6,390 | $5,020 |
| 2020 | $611 | $10,310 | $6,390 | $3,920 |
| 2019 | $603 | $10,310 | $6,390 | $3,920 |
| 2018 | $588 | $9,990 | $6,430 | $3,560 |
| 2017 | $612 | $9,990 | $6,430 | $3,560 |
| 2016 | $605 | $10,320 | $7,110 | $3,210 |
| 2015 | $618 | $10,320 | $7,110 | $3,210 |
| 2013 | $618 | $10,320 | $7,110 | $3,210 |
Source: Public Records
Map
Nearby Homes
- TBD S Highway 13 1 32 Acres
- 2773 W 1st St
- 198 Cedar Ct
- TBD Pinon Cir
- 535 3rd Ave W
- TBD Villa W
- TBD W Victory Way 6 66 Acres
- 925 W 1st St
- TBD Crescent Dr & Riford Rd
- 676 Overlook Dr
- TBD Hwy 40
- 2110 Alder Place
- TBD Finley Ln
- Tbd Sunset Cir
- 3839 W 6th St
- 3435 Lenox Rd
- 3863 W 6th St
- 3865 W 6th St
- 739 Riford Rd
- 3025 Doe Run Dr
- 195 Clay Ave
- 195 Clay Ave Unit Lot 802
- 175 Clay Ave
- 214 Clay Ave
- 176 Clay Ave
- 194 Clay Ave
- 277 Clay Ave
- 2450 W Third Street and 277 Clay
- 2210 W 3rd St
- 2210 W 3rd St
- 2210 W 3rd St
- 2210 W 3rd St
- 2210 W 3rd St
- 2210 W 3rd St
- 2210 W 3rd St
- 2210 W 3rd St
- 2210 W 3rd St
- 2210 W 3rd St
- 2210 W 3rd St
- 2210 W 3rd St