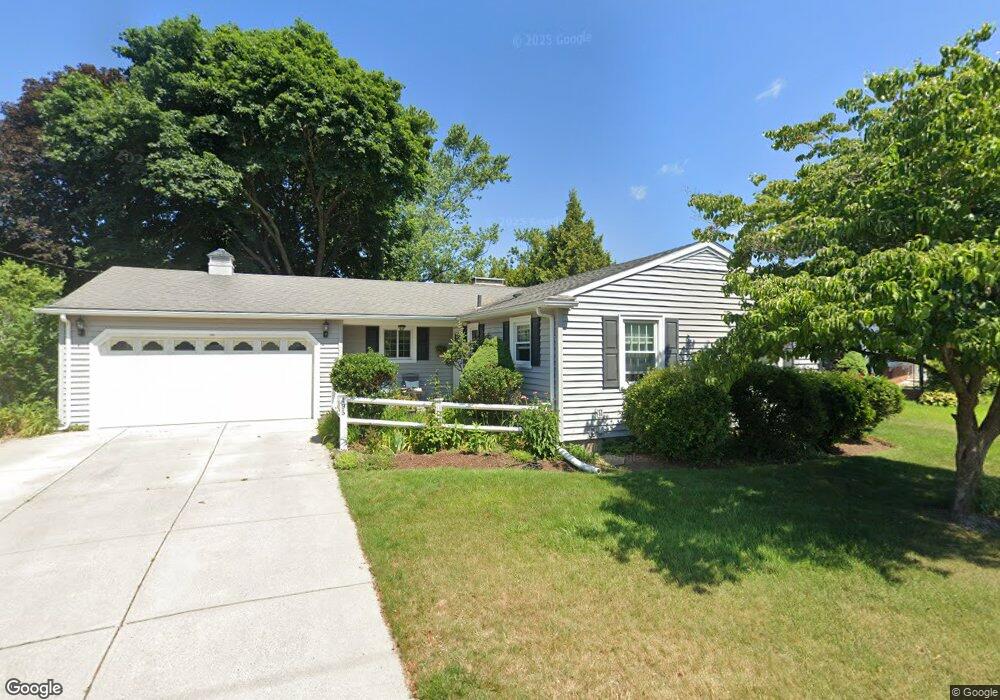
195 Crest Dr Pawtucket, RI 02861
Darlington NeighborhoodEstimated Value: $428,000 - $500,000
3
Beds
2
Baths
1,228
Sq Ft
$376/Sq Ft
Est. Value
About This Home
This home is located at 195 Crest Dr, Pawtucket, RI 02861 and is currently estimated at $461,332, approximately $375 per square foot. 195 Crest Dr is a home located in Providence County with nearby schools including St Cecilia School and Dayspring Christian Academy.
Ownership History
Date
Name
Owned For
Owner Type
Purchase Details
Closed on
Aug 24, 2010
Sold by
Microulis Steven A and Rodgers-Microulis Frances
Bought by
Microulis Steven A and Microulis Francis R
Current Estimated Value
Purchase Details
Closed on
Aug 30, 1995
Sold by
Germani Sal J and Germani Louise
Bought by
Microulis Steven A and Microulis Frances
Purchase Details
Closed on
May 25, 1990
Sold by
Benn Aline W
Bought by
Germani Sal J
Create a Home Valuation Report for This Property
The Home Valuation Report is an in-depth analysis detailing your home's value as well as a comparison with similar homes in the area
Home Values in the Area
Average Home Value in this Area
Purchase History
| Date | Buyer | Sale Price | Title Company |
|---|---|---|---|
| Microulis Steven A | -- | -- | |
| Microulis Steven A | $125,000 | -- | |
| Germani Sal J | $131,500 | -- |
Source: Public Records
Mortgage History
| Date | Status | Borrower | Loan Amount |
|---|---|---|---|
| Open | Germani Sal J | $119,000 | |
| Previous Owner | Germani Sal J | $50,000 | |
| Previous Owner | Germani Sal J | $35,000 |
Source: Public Records
Tax History
| Year | Tax Paid | Tax Assessment Tax Assessment Total Assessment is a certain percentage of the fair market value that is determined by local assessors to be the total taxable value of land and additions on the property. | Land | Improvement |
|---|---|---|---|---|
| 2025 | $5,298 | $402,900 | $165,700 | $237,200 |
| 2024 | $4,972 | $402,900 | $165,700 | $237,200 |
| 2023 | $5,043 | $297,700 | $103,100 | $194,600 |
| 2022 | $4,936 | $297,700 | $103,100 | $194,600 |
| 2021 | $4,936 | $297,700 | $103,100 | $194,600 |
| 2020 | $4,855 | $232,400 | $87,700 | $144,700 |
| 2019 | $4,855 | $232,400 | $87,700 | $144,700 |
| 2018 | $4,678 | $232,400 | $87,700 | $144,700 |
| 2017 | $4,805 | $211,500 | $93,000 | $118,500 |
| 2016 | $4,630 | $211,500 | $93,000 | $118,500 |
| 2015 | $4,630 | $211,500 | $93,000 | $118,500 |
| 2014 | $4,213 | $182,700 | $80,600 | $102,100 |
Source: Public Records
Map
Nearby Homes
- 70 Archer St
- 15 Don Ct
- 69 Clews St
- 13 Rita Dr
- 0 Perrin Ave
- 34 Elmcrest Dr
- 26 Blackburn St
- 49 Ames St
- 56 Liberty Dr
- 1346 Newport Ave
- 1346 Newport Ave Unit B-21
- 57 Cedarbrook Rd
- 0 Cedar St
- 65 Cedarbrook Rd
- 489 Benefit St
- 888 Central Ave
- 886 Central Ave
- 39 Clinton St
- 15 Draper St
- 105 Metropolitan Park Ave
Your Personal Tour Guide
Ask me questions while you tour the home.