Estimated Value: $274,220 - $611,000
Studio
1
Bath
2,748
Sq Ft
$183/Sq Ft
Est. Value
About This Home
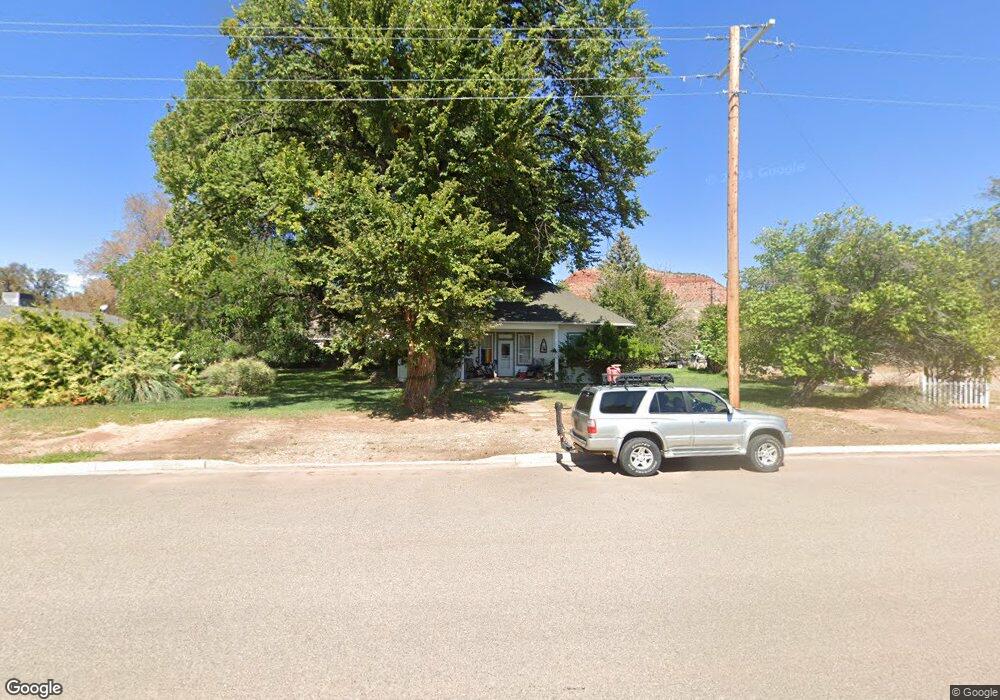
This home is located at 195 E 100 S, Kanab, UT 84741 and is currently estimated at $503,805, approximately $183 per square foot. 195 E 100 S is a home located in Kane County with nearby schools including Kanab Elementary School, Kanab Middle School, and Kanab High School.
Ownership History
Date
Name
Owned For
Owner Type
Purchase Details
Closed on
May 20, 2014
Sold by
Eric L Eric L and Brinkerhoff Colene
Bought by
Brinkerhoff Raymond and Brinkerhoff Amanda
Current Estimated Value
Purchase Details
Closed on
Feb 4, 2008
Sold by
Berryville Hills Development Llc
Bought by
Brinkerhoff Eric L and Brinkerhoff Colene
Purchase Details
Closed on
Jul 17, 2006
Sold by
Brinkerhoff Eric L and Brinkerhoff Colene
Bought by
Brinkerhoff Eric L and Brinkerhoff Colene
Purchase Details
Closed on
Jun 13, 2005
Sold by
Dos Pollos Llc
Bought by
Berryville Hills Development Llc
Create a Home Valuation Report for This Property
The Home Valuation Report is an in-depth analysis detailing your home's value as well as a comparison with similar homes in the area
Home Values in the Area
Average Home Value in this Area
Purchase History
| Date | Buyer | Sale Price | Title Company |
|---|---|---|---|
| Brinkerhoff Raymond | -- | -- | |
| Brinkerhoff Eric L | -- | -- | |
| Brinkerhoff Eric L | -- | -- | |
| Berryville Hills Development Llc | -- | -- |
Source: Public Records
Tax History
| Year | Tax Paid | Tax Assessment Tax Assessment Total Assessment is a certain percentage of the fair market value that is determined by local assessors to be the total taxable value of land and additions on the property. | Land | Improvement |
|---|---|---|---|---|
| 2025 | $972 | $217,653 | $58,033 | $159,620 |
| 2024 | $1,001 | $122,474 | $30,397 | $92,077 |
| 2023 | $892 | $112,656 | $28,950 | $83,706 |
| 2022 | $1,000 | $112,806 | $29,816 | $82,990 |
| 2021 | $1,124 | $188,652 | $41,800 | $146,852 |
| 2020 | $1,161 | $188,652 | $41,800 | $146,852 |
| 2019 | $1,074 | $169,415 | $41,800 | $127,615 |
| 2018 | $1,077 | $169,415 | $41,800 | $127,615 |
| 2017 | $1,091 | $167,549 | $54,340 | $113,209 |
| 2016 | $1,116 | $167,549 | $54,340 | $113,209 |
| 2015 | $968 | $155,009 | $41,800 | $113,209 |
| 2014 | $968 | $141,109 | $41,800 | $99,309 |
| 2013 | -- | $77,655 | $0 | $0 |
Source: Public Records
Map
Nearby Homes
- 195 E 100 S
- Lot #3 Sr 89 & Sedona Valley Rd
- 76 S 200 E
- 175 E 100 S
- Lot #4 Sr 89 & Sedona Valley Rd
- 159 E 100 S
- 56 S 200 E
- Lot #5 Sr 89 & Sedona Valley Rd
- 196 E 100 S
- 176 E 100 S
- 207 E 100 S
- 160 E 100 S
- 143 E 100 S Unit 2
- 143 E 100 S Unit 1
- 143 E 100 S
- 53 S 200 E
- 227 E 100 S
- 218 E 100 S
- 243 E 100 S
- 133 S 200 E
Your Personal Tour Guide
Ask me questions while you tour the home.