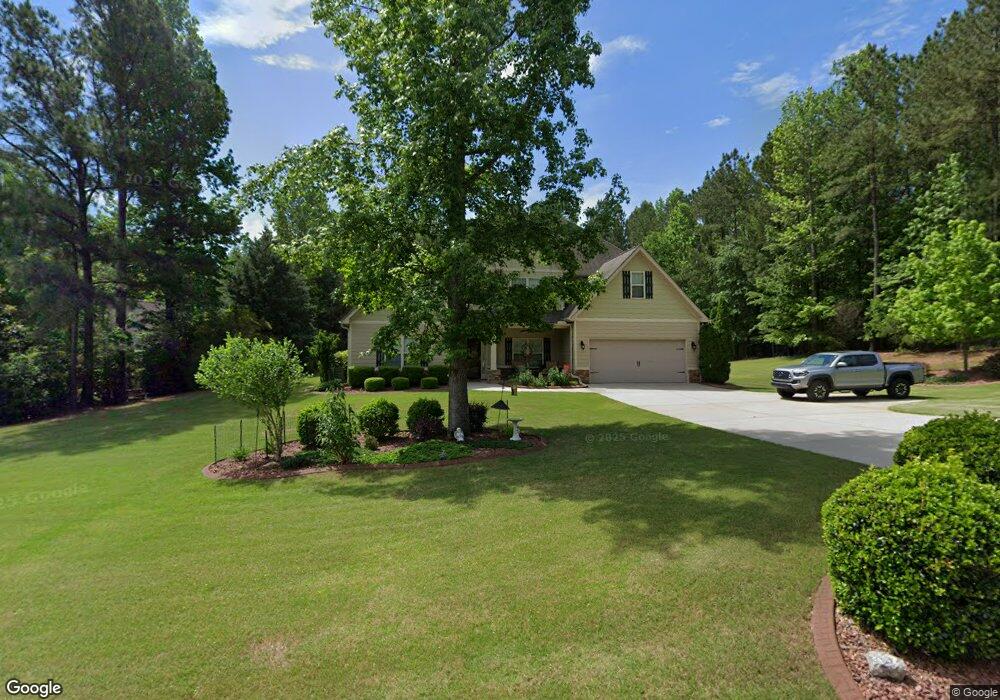
195 Gracie Gardens Ct Newnan, GA 30263
Estimated Value: $510,078 - $614,000
4
Beds
4
Baths
3,508
Sq Ft
$159/Sq Ft
Est. Value
About This Home
This home is located at 195 Gracie Gardens Ct, Newnan, GA 30263 and is currently estimated at $558,020, approximately $159 per square foot. 195 Gracie Gardens Ct is a home located in Coweta County with nearby schools including Arnco-Sargent Elementary School, Madras Middle School, and Newnan High School.
Ownership History
Date
Name
Owned For
Owner Type
Purchase Details
Closed on
Nov 10, 2009
Sold by
Scott Neely Construction Inc
Bought by
Albracht Kathy J
Current Estimated Value
Purchase Details
Closed on
Apr 7, 2008
Sold by
Neely-Perry Communities Inc
Bought by
Scott Neely Construction Inc
Purchase Details
Closed on
Jan 15, 2003
Sold by
Plum Creek Timber Company Inc
Bought by
Neely-Perry Communities Inc
Purchase Details
Closed on
Jan 13, 2003
Sold by
Plum Creek Timber Company Inc
Bought by
Neely-Perry Communities Inc
Purchase Details
Closed on
Oct 6, 2001
Sold by
North American Timbe
Bought by
Plum Creek Timber Company Inc
Purchase Details
Closed on
Apr 16, 1999
Sold by
Georgia Pacific Corp
Bought by
North American Timbe
Purchase Details
Closed on
Mar 31, 1980
Bought by
Georgia Pacific Corp
Create a Home Valuation Report for This Property
The Home Valuation Report is an in-depth analysis detailing your home's value as well as a comparison with similar homes in the area
Home Values in the Area
Average Home Value in this Area
Purchase History
| Date | Buyer | Sale Price | Title Company |
|---|---|---|---|
| Albracht Kathy J | $257,700 | -- | |
| Scott Neely Construction Inc | $816,000 | -- | |
| Neely-Perry Communities Inc | -- | -- | |
| Neely-Perry Communities Inc | $779,400 | -- | |
| Plum Creek Timber Company Inc | $1,018,400 | -- | |
| North American Timbe | $16,000 | -- | |
| Georgia Pacific Corp | -- | -- |
Source: Public Records
Tax History Compared to Growth
Tax History
| Year | Tax Paid | Tax Assessment Tax Assessment Total Assessment is a certain percentage of the fair market value that is determined by local assessors to be the total taxable value of land and additions on the property. | Land | Improvement |
|---|---|---|---|---|
| 2024 | $4,414 | $194,749 | $32,000 | $162,749 |
| 2023 | $4,414 | $186,895 | $32,000 | $154,895 |
| 2022 | $3,912 | $163,486 | $32,000 | $131,486 |
| 2021 | $3,697 | $145,110 | $20,000 | $125,110 |
| 2020 | $3,383 | $132,392 | $20,000 | $112,392 |
| 2019 | $3,478 | $123,624 | $12,000 | $111,624 |
| 2018 | $3,485 | $123,624 | $12,000 | $111,624 |
| 2017 | $3,483 | $123,624 | $12,000 | $111,624 |
| 2016 | $3,062 | $110,447 | $12,000 | $98,447 |
| 2015 | $2,708 | $99,741 | $12,000 | $87,741 |
| 2014 | $2,093 | $78,625 | $10,000 | $68,625 |
Source: Public Records
Map
Nearby Homes
- 0 J Smith Rd Unit 10192890
- 571 Kory Dr
- 44 Fendley Trace
- 440 Kory Dr
- 7 Harris Ct
- 100 Rudders Crossing
- 82 Bantry Park Dr
- 249 Gibson Rd
- 212 Westwind Dr
- 171 Brimer Rd
- 90 Westwind Dr
- 201 Drews Ridge Dr
- 0 Piney Wood Dr Unit 9 10589519
- 62 N Shore at Redwine Dr
- 14 W Shore Ct
- 264 Kendall St
- 237 Kory Dr
- 64 Redwine Overlook
- 5 Gibson Rd
- 3009 Roscoe Rd
- 207 Gracie Gardens Ct
- 14 Annabelle Ln
- 164 Gracie Gardens Ct
- 204 Gracie Gardens Ct
- 34 Annabelle Ln
- 212 Gracie Gardens Ct
- 227 Gracie Gardens Ct
- 28 Buttercup Cove
- 27 Buttercup Cove Unit 55
- 66 Annabelle Ln
- 0 Annabelle Ln Unit LOT 36 7243796
- 0 Annabelle Ln Unit LOT 34 7243783
- 0 Annabelle Ln Unit LOT 35 7243793
- 0 Annabelle Ln Unit 34
- 0 Annabelle Ln Unit 36
- 0 Annabelle Ln
- 0 Annabelle Ln Unit 33
- 0 Annabelle Ln Unit LOT 38
- 0 Annabelle Ln Unit 32
- 0 Annabelle Ln Unit 33 7461414