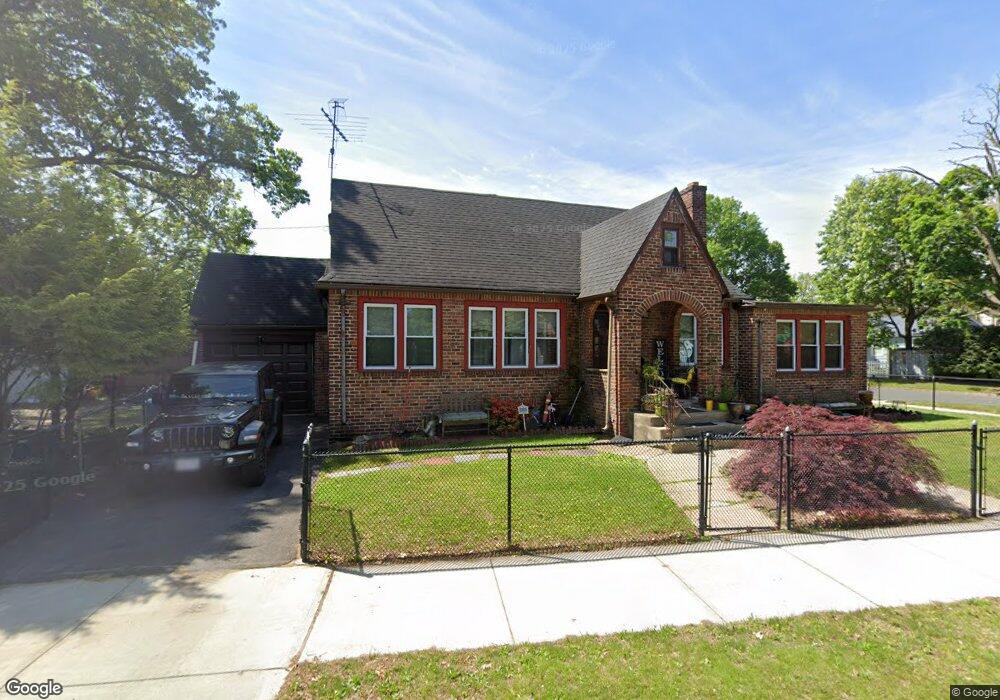
195 Lang St Springfield, MA 01104
East Springfield NeighborhoodEstimated Value: $256,000 - $323,000
3
Beds
3
Baths
1,663
Sq Ft
$177/Sq Ft
Est. Value
About This Home
This home is located at 195 Lang St, Springfield, MA 01104 and is currently estimated at $295,058, approximately $177 per square foot. 195 Lang St is a home located in Hampden County with nearby schools including Van Sickle Academy, Springfield Central High School, and Roger L. Putnam Vocational Technical Academy.
Ownership History
Date
Name
Owned For
Owner Type
Purchase Details
Closed on
Oct 2, 2001
Sold by
Bongiorni Vincent M and Bongiorni Rita M
Bought by
Huertas Maria
Current Estimated Value
Home Financials for this Owner
Home Financials are based on the most recent Mortgage that was taken out on this home.
Original Mortgage
$83,800
Outstanding Balance
$32,850
Interest Rate
6.91%
Mortgage Type
Purchase Money Mortgage
Estimated Equity
$262,208
Create a Home Valuation Report for This Property
The Home Valuation Report is an in-depth analysis detailing your home's value as well as a comparison with similar homes in the area
Home Values in the Area
Average Home Value in this Area
Purchase History
| Date | Buyer | Sale Price | Title Company |
|---|---|---|---|
| Huertas Maria | $84,500 | -- |
Source: Public Records
Mortgage History
| Date | Status | Borrower | Loan Amount |
|---|---|---|---|
| Open | Huertas Maria | $83,800 | |
| Closed | Huertas Maria | $3,352 |
Source: Public Records
Tax History
| Year | Tax Paid | Tax Assessment Tax Assessment Total Assessment is a certain percentage of the fair market value that is determined by local assessors to be the total taxable value of land and additions on the property. | Land | Improvement |
|---|---|---|---|---|
| 2025 | $3,459 | $220,600 | $38,400 | $182,200 |
| 2024 | $3,532 | $219,900 | $38,400 | $181,500 |
| 2023 | $3,098 | $181,700 | $35,700 | $146,000 |
| 2022 | $3,463 | $184,000 | $33,400 | $150,600 |
| 2021 | $3,117 | $164,900 | $30,400 | $134,500 |
| 2020 | $3,047 | $156,000 | $30,400 | $125,600 |
| 2019 | $2,299 | $116,800 | $31,400 | $85,400 |
| 2018 | $2,226 | $113,100 | $31,400 | $81,700 |
| 2017 | $2,094 | $106,500 | $28,400 | $78,100 |
| 2016 | $2,906 | $147,800 | $28,400 | $119,400 |
| 2015 | $2,884 | $146,600 | $28,400 | $118,200 |
Source: Public Records
Map
Nearby Homes
- 114 Monrovia St
- 58 Eureka St
- 152 Monrovia St
- 158 Monrovia St
- 200 El Paso St
- 147 Bowles Park
- 225 Osborne Terrace
- 47 Holy Cross St
- 251 Edendale St
- 173 Russell St
- 1730 Carew St
- 42 Marquette St
- 83 Oklahoma St
- 102 San Miguel St
- 112 W Canton Cir
- 143 Saint James Cir
- 70 Chateaugay St
- 104 Chateaugay St
- 44 Naismith St
- 66 Bromont St
- 9 Monrovia St
- 26 Windemere St
- 15 Monrovia St
- 22 Windemere St
- 10 Monrovia St Unit Street
- 10 Monrovia St
- 179 Lang St
- 52 Windemere St Unit 54
- 35 Windemere St Unit 37
- 16 Monrovia St
- 41 Windemere St
- 19 Windermere Unit 1
- 45 Windemere St
- 25 Windemere St Unit 27
- 20 Monrovia St
- 21 Windemere St Unit n/a
- 21 Windemere St
- 175 Lang St
- 19-21 Windemere St
- 51 Windemere St
Your Personal Tour Guide
Ask me questions while you tour the home.